

Rocket Companies Inc. stocks have been trading up by 5.83 percent amid strong mortgage origination growth and upbeat housing outlook.
Key Takeaways Traders Need To Know
- Rocket Companies reported Q3 adjusted EPS of $0.15, beating consensus expectations of $0.13–$0.14 per share.
- Q3 revenue came in at $3.28B, far above the $2.58B FactSet estimate and ahead of management’s earlier guidance.
- Management flagged market share gains and the highest profitability margin in nearly five years, even with mortgage rates near three‑year highs.
- For Q4, guidance of $2.10B–$2.30B in revenue points to a step down from Q3 but still solid performance.
- Major Wall Street firms trimmed RKT price targets but kept bullish ratings, citing macro housing and rate headwinds.
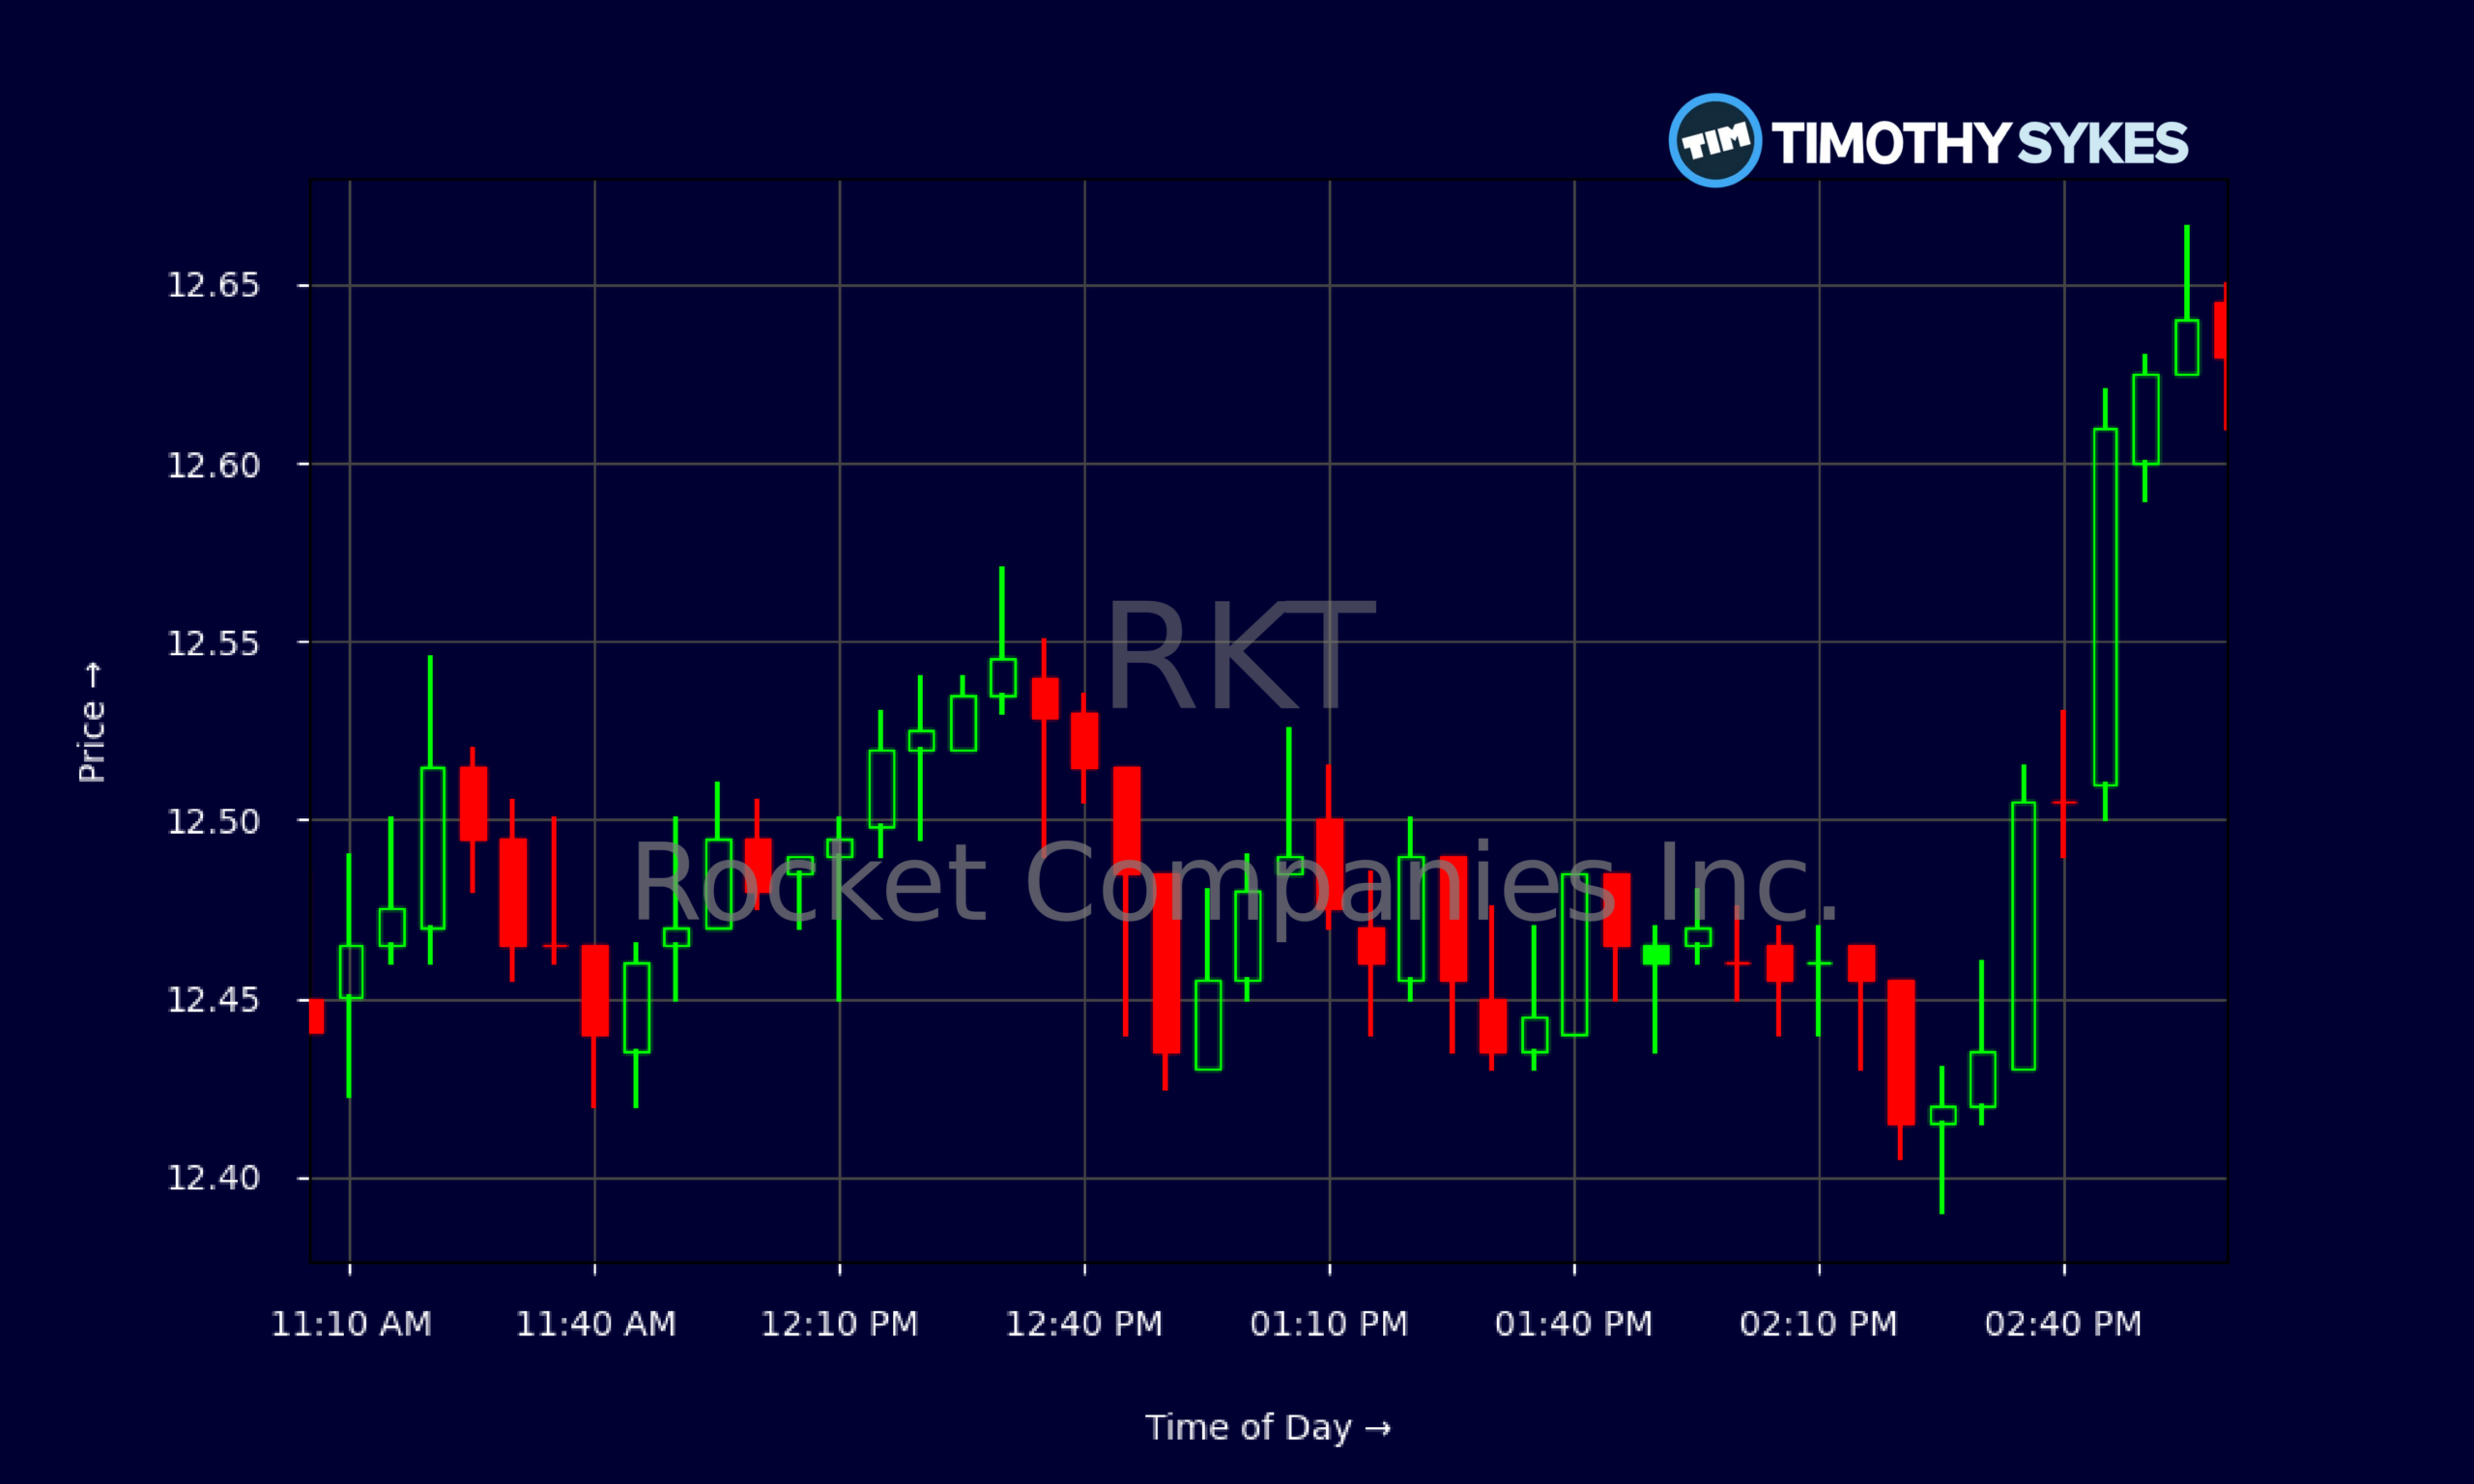
Live Update At 15:03:28 EDT: On Friday, October 30, 2026 Rocket Companies Inc. stock [NYSE: RKT] is trending up by 5.83%! Discover the key drivers behind this movement as well as our expert analysis in the detailed breakdown below.
Quick Financial Overview
RKT has quietly turned into a grind‑higher story on the chart. Over the last couple of weeks, Rocket Companies has pushed from around $10.50 to roughly $12.60, a steady uptrend with higher lows on the daily candles. That tells traders money is rotating back into the name ahead of and after earnings.
Intraday action on the latest session backs that up. RKT opened near $12.55, dipped briefly, then spent most of the day grinding in a tight $12.40–$12.65 band. That kind of controlled range, with closes near the top end, often signals accumulation rather than a blow‑off top.
On the fundamentals, Rocket Companies is now running at roughly $6.26B in annual revenue with a pretax margin around 10%. A price‑to‑sales ratio near 3.6 and a P/E north of 50 say traders are paying up for growth and for the platform story, not for deep value. Leverage is real, with total debt running above equity, but RKT also sits on over $3.1B in cash.
More Breaking News
For active traders, that mix—uptrending chart, premium valuation, real leverage—creates a classic momentum‑plus‑headline setup. Strong numbers can squeeze shorts. Disappointments can unwind fast.
Why Traders Are Watching RKT After Q3 Earnings
The latest earnings print is exactly the kind of catalyst short‑term traders wait for. Rocket Companies dropped a Q3 revenue number of $3.28B, blowing past the $2.58B consensus and even topping earlier internal guidance. Adjusted EPS came in at $0.15, beating the $0.13–$0.14 range that Wall Street had penciled in and doubling year over year. RKT did this while mortgage rates sat near three‑year highs.
Management said Q3 delivered the strongest profitability margin in nearly five years and that Rocket Companies gained market share in both purchase and refinance. That’s key. In a shrinking or choppy mortgage market, gaining share usually means somebody else is losing it. Traders looking for durable stories pay attention when a company grows its slice of a tough pie.
Yet despite the blowout quarter, RKT slipped in after‑hours trading when numbers hit. The reason sits in the guidance. For Q4, Rocket Companies is calling for revenue of $2.10B–$2.30B, a clear step down from Q3’s surge. The street read that as “great quarter, cooler next one,” not “straight‑line rocket ship.”
Layer on the analyst moves. Barclays, Morgan Stanley, Keefe Bruyette, and StoneX all cut their RKT price targets, but every one of them stuck with bullish ratings—Overweight, Outperform, or Buy. The message to traders: the core story is intact, but macro headwinds like high rates and softer origination volumes cap upside for now.
At the same time, Rocket Companies now owns and integrates Redfin, giving RKT a real edge in housing data and online distribution. Redfin’s stats show a buyer’s market: sellers outnumber buyers by about 63%, roughly 21% of sellers cut prices in late September, and mortgage rates above 7% are crushing demand. That backdrop keeps volatility high, and volatility is what traders hunt.
Conclusion
Put it all together and RKT sits at an interesting crossroads. On one side, Rocket Companies just proved it can produce a powerful quarter in a nasty housing tape—crushing revenue expectations, expanding margins to five‑year highs, and grabbing market share. On the other side, management’s Q4 guide and the broad analyst target cuts tell traders not to extrapolate Q3 straight into 2027.
The Redfin deal now looks more strategic with every data release. Rocket Companies is using Redfin’s view of price cuts, buyer‑seller imbalances, and long‑term affordability models to navigate a market that favors patient, qualified buyers. Those same reports suggest housing affordability could drift back toward 2018‑style levels over the next 2–10+ years, depending on rates and income growth. For traders who track cycles, that’s the bigger backdrop behind RKT’s day‑to‑day moves.
In this kind of setup, many in the Tim Sykes community focus on price action first and headlines second. As Tim Sykes likes to remind traders, “Patterns repeat, but only if you’re disciplined enough to wait for them and ruthless enough to cut losses when they fail.” As millionaire penny stock trader and teacher Tim Sykes says, “It’s not about how much money you make; it’s about how much money you keep.” RKT’s chart, earnings beat, and cautious guide create exactly the kind of pattern‑driven trading arena where that discipline matters most. This analysis is for educational and research purposes only—not a signal to buy or sell.
This is stock news, not investment advice. Timothy Sykes News delivers real-time stock market news focused on key catalysts driving short-term price movements. Our content is tailored for active traders and investors seeking to capitalize on rapid price fluctuations, particularly in volatile sectors like penny stocks. Readers come to us for detailed coverage on earnings reports, mergers, FDA approvals, new contracts, and unusual trading volumes that can trigger significant short-term price action. Some users utilize our news to explain sudden stock movements, while others rely on it for diligent research into potential investment opportunities.
Dive deeper into the world of trading with Timothy Sykes, renowned for his expertise in penny stocks. Explore his top picks and discover the strategies that have propelled him to success with these articles:
- Penny Stocks Trading Guide
- Best Penny Stocks Under $1 to Buy Today
- Top 8 Penny Stocks to Watch on Robinhood
Once you’ve got some stocks on watch, elevate your trading game with StocksToTrade the ultimate platform for traders. With specialized tools for swing and day trading, StocksToTrade will guide you through the market’s twists and turns.
Dig into StocksToTrade’s watchlists here:





Leave a reply