
Pacific Gas & Electric Co. faces mounting wildfire liability concerns, and its stocks have been trading down by -7.44 percent.
Key Takeaways
- Shares of Pacific Gas & Electric Co. slipped from near $18.40 to around $16.60, a sharp pullback after weeks of steady grinding higher.
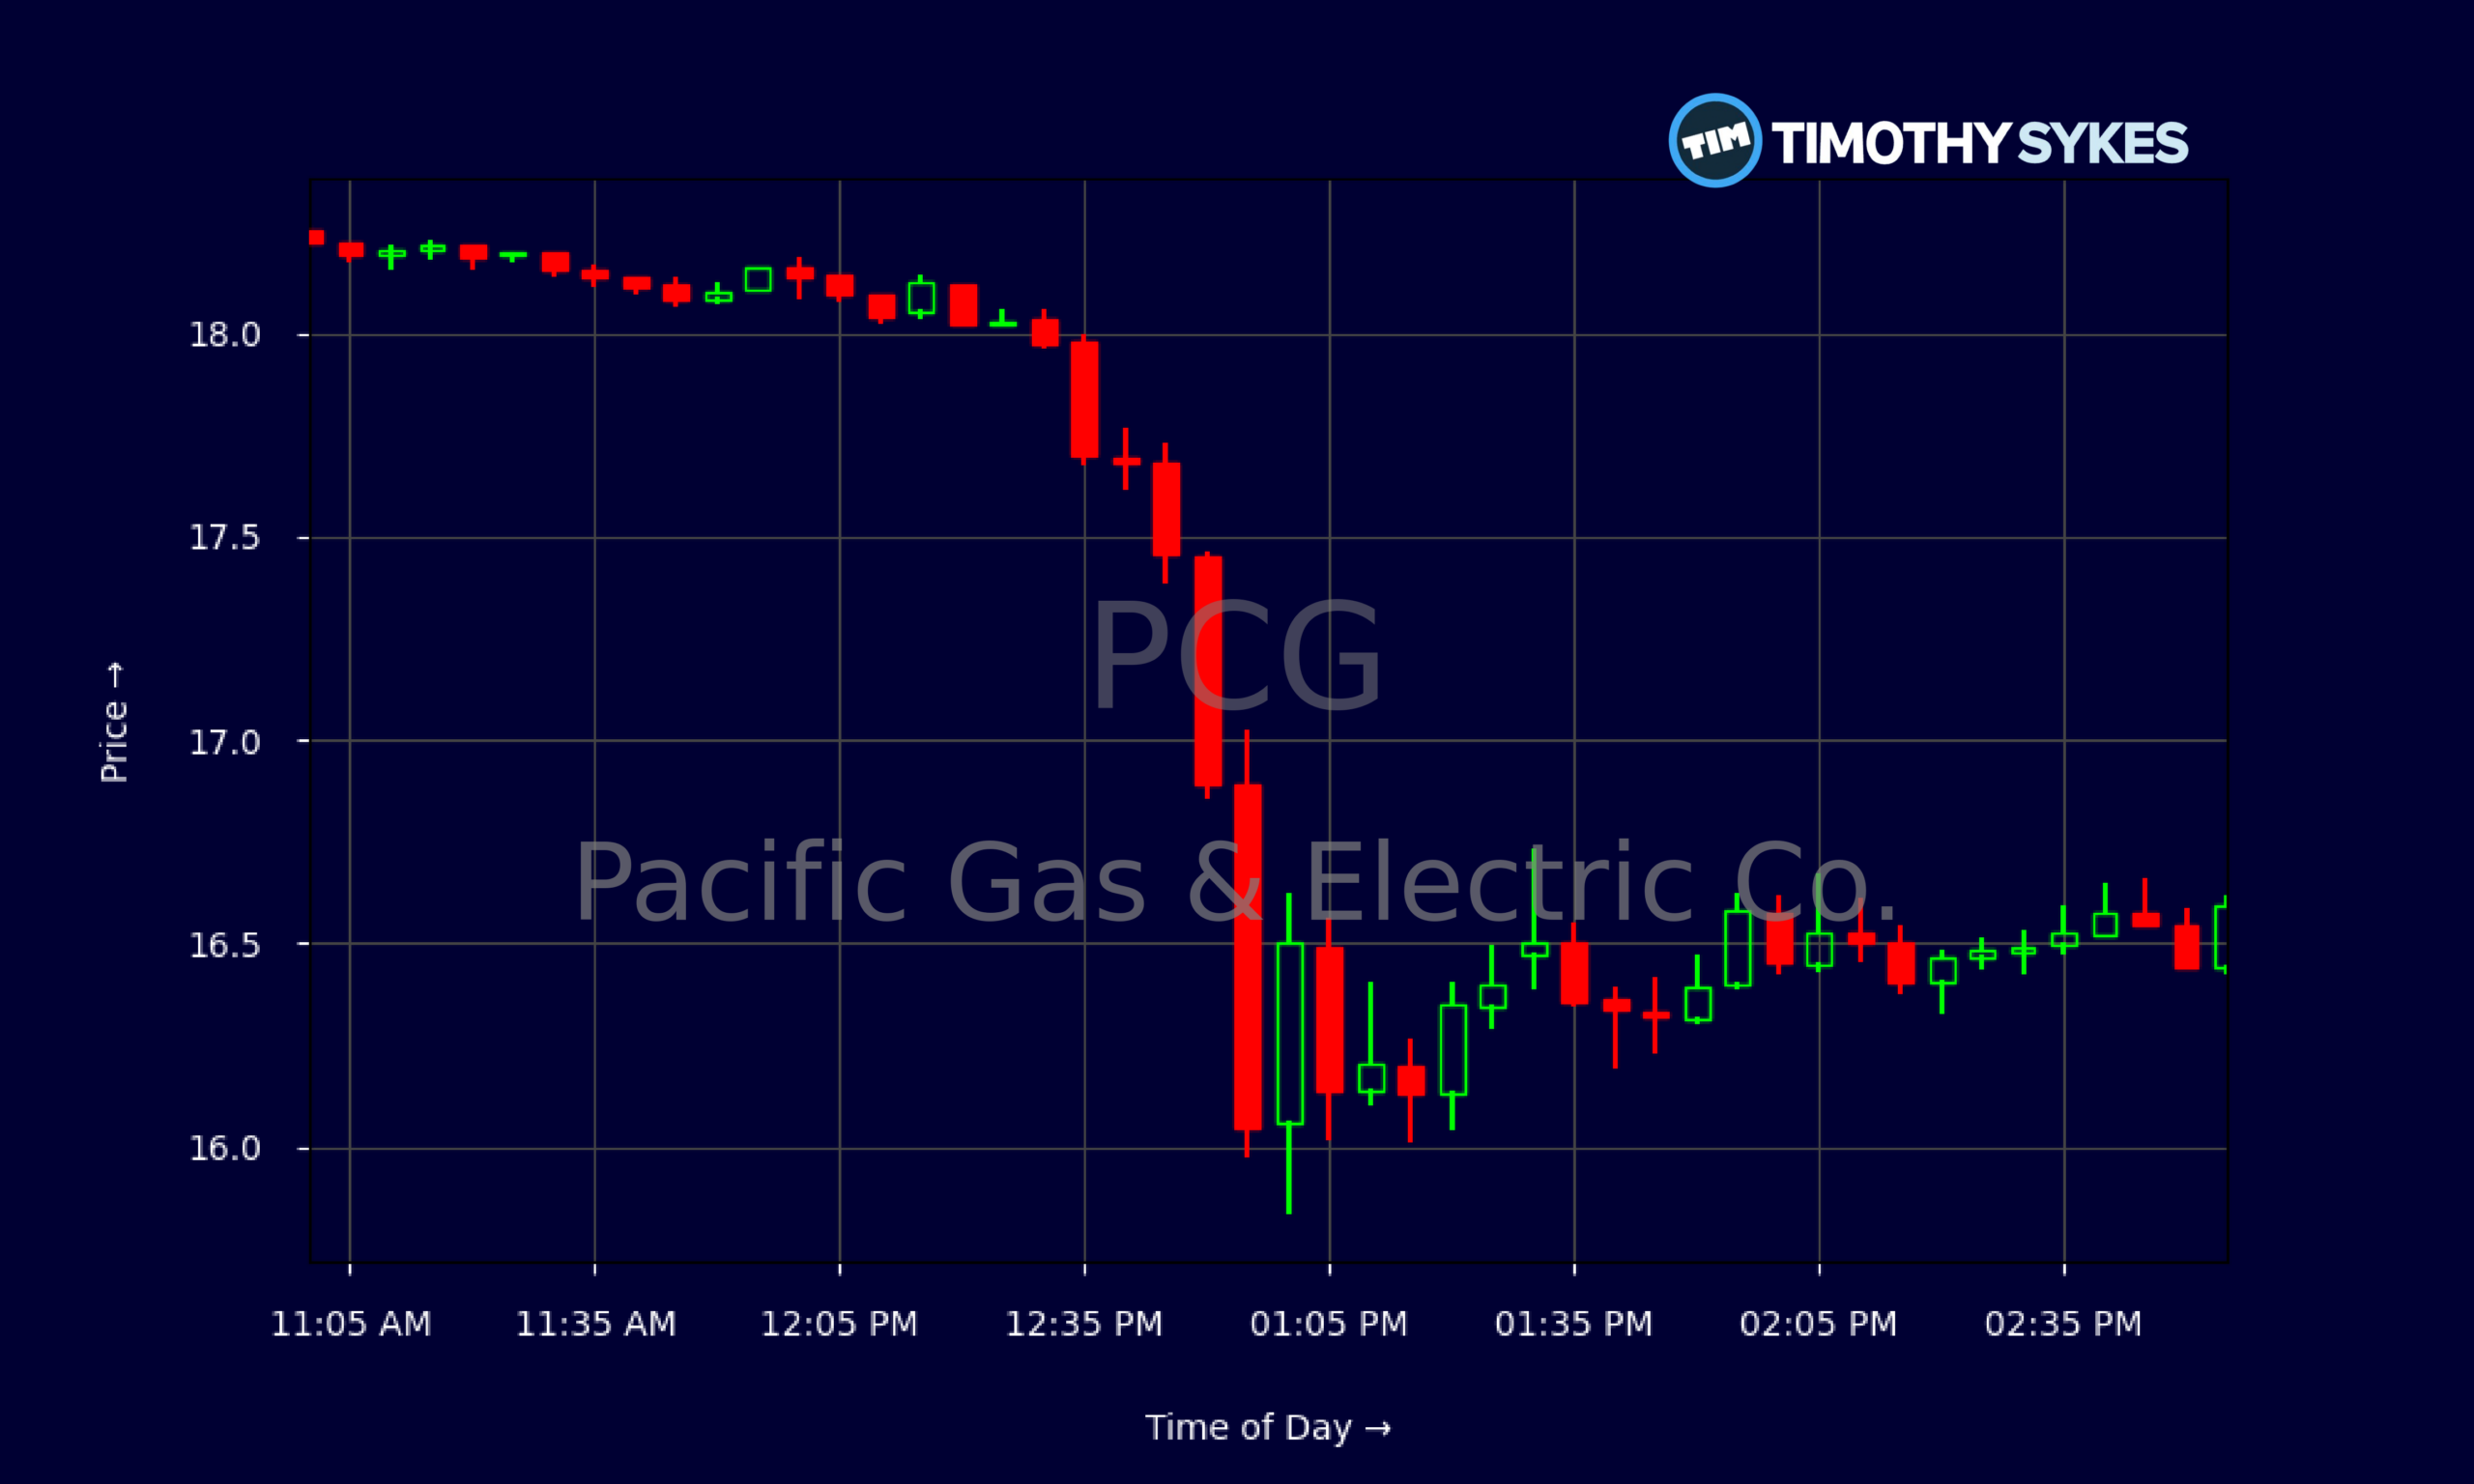
- Intraday PCG trading showed a clear trend day lower, with a fast flush from the $18s into the mid-$15s before a late-day bounce.
- Financials show strong revenue and fat gross margins, but PCG carries heavy debt and negative free cash flow from large capital projects.
- Valuation for PCG, at roughly 13x earnings and 1.9x sales, looks moderate, keeping the stock firmly on watch lists for range and breakout traders.
Live Update At 15:02:07 EDT: On Friday, August 28, 2026 Pacific Gas & Electric Co. stock [NYSE: PCG] is trending down by -7.44%! Discover the key drivers behind this movement as well as our expert analysis in the detailed breakdown below.
Quick Financial Overview
For traders tracking Pacific Gas & Electric Co., the fundamentals paint a mixed but tradable picture. PCG is a massive regulated utility with about $24.9B in annual revenue and an 85.8% gross margin, which is huge. That margin reflects the capital-heavy, regulated nature of the business, not a high-tech profit machine, so traders need to read it correctly.
PCG posts an EBIT margin around 22.7% and a total profit margin just under 12%. Those are respectable, and they support a price-to-earnings ratio near 13.2, which keeps PCG in “reasonable valuation” territory versus many crowded momentum names. Price-to-book near 1.5 also signals the market is not paying an extreme premium for Pacific Gas & Electric Co.’s asset base.
More Breaking News
The problem side is leverage. Total debt-to-equity sits near 2, with a leverage ratio of 4.5 and interest coverage only about 1.9 times. PCG is paying a lot to service that debt, and it shows in the cash flows. Last quarter, Pacific Gas & Electric Co. generated about $906M in operating cash but spent roughly $2.97B on capital expenditures, leaving free cash flow deeply negative. For traders, that means a fundamentally solid utility still tied to a heavy capex and debt cycle, which can amplify moves when sentiment shifts.
Why Traders Are Watching PCG Price Action
PCG has been a slow, steady climber on the daily chart, grinding from the mid-$17s toward the high-$18s over the past few weeks. That shift signaled quiet accumulation. But the latest session flipped the script hard. Pacific Gas & Electric Co. opened near $18.22 and briefly tagged $18.35 before sellers stepped in. From there, PCG broke down all day, hitting a low near $15.84 before clawing back to close around $16.62.
For active traders, that’s not noise. That’s a character change.
The intraday 5‑minute chart shows PCG trading heavy right out of the gate, failing to hold the premarket $18.60–$18.70 zone. Once Pacific Gas & Electric Co. cracked below $18.00 and then $17.50, the selling accelerated, with a brutal midday wash from the low-$17s to the mid-$15s. That kind of straight-line flush in a large-cap utility gets attention. It often signals funds de-risking or a shift in expectations, even if headlines are quiet.
From early afternoon on, PCG built a base near $16.00 and then staged a slow bounce into the close, finishing well off the lows. That late-day support around $16.00–$16.20 is now a key line in the sand. Short-term traders will treat it as a pivot: hold that zone, and a bounce back toward $17.50–$18.00 is on the table; lose it with volume, and the next leg down opens up.
The bigger picture for Pacific Gas & Electric Co. is a stock that had been stair-stepping higher on the daily chart but just printed a wide-range, high-volume reversal candle. Those are the days where PCG often becomes a day-trading ticker rather than a sleepy utility — exactly the kind of shift momentum traders look for.
Conclusion
Pacific Gas & Electric Co. now sits at an interesting crossroads. On one side, PCG is a giant utility with $145.1B in assets, predictable revenue, and a P/E around 13 — not the typical profile of a high-flyer. On the other, it carries over $62.1B of long-term debt, thin interest coverage, and a recent quarter where capital spending dwarfed cash in the door. When a name like that finally breaks its steady uptrend, the tape deserves full respect.
For traders, the key is not to marry a story. As millionaire penny stock trader and teacher Tim Sykes, says, “You must adapt to the market; the market will not adapt to you.” The PCG chart is telling you where the real money is leaning. The daily uptrend off the $17 area has been damaged by this flush. Now, $16 becomes a crucial support band, while the $17.80–$18.40 zone turns into heavy overhead supply. Pacific Gas & Electric Co. will likely chop between those levels until a new catalyst or strong market move forces a breakout.
Short-term, reactive traders can stalk clean intraday levels from the 5‑minute chart — prior support turned resistance, VWAP, and the afternoon base near $16.30–$16.50. Swing traders in PCG should focus on risk first, not reward, and size around the volatility spike just shown.
Tim Sykes likes to tell traders, “Patterns repeat, but you have to be prepared and disciplined enough to take advantage of them.” PCG is showing a classic pattern shift: from slow grind to sharp volatility. Study the chart, define your risk, and let Pacific Gas & Electric Co. prove its next move before you commit real capital.
This is stock news, not investment advice. Timothy Sykes News delivers real-time stock market news focused on key catalysts driving short-term price movements. Our content is tailored for active traders and investors seeking to capitalize on rapid price fluctuations, particularly in volatile sectors like penny stocks. Readers come to us for detailed coverage on earnings reports, mergers, FDA approvals, new contracts, and unusual trading volumes that can trigger significant short-term price action. Some users utilize our news to explain sudden stock movements, while others rely on it for diligent research into potential investment opportunities.
Dive deeper into the world of trading with Timothy Sykes, renowned for his expertise in penny stocks. Explore his top picks and discover the strategies that have propelled him to success with these articles:
- Penny Stocks Trading Guide
- Best Penny Stocks Under $1 to Buy Today
- Top 8 Penny Stocks to Watch on Robinhood
Once you’ve got some stocks on watch, elevate your trading game with StocksToTrade the ultimate platform for traders. With specialized tools for swing and day trading, StocksToTrade will guide you through the market’s twists and turns.
Dig into StocksToTrade’s watchlists here:





Leave a reply