

Ondas Inc stocks have been trading down by -11.2 percent amid heightened investor concern over its widening quarterly losses.
Key Takeaways
- ONDS has pulled back from recent highs near $7 and now trades in the mid-$4s, putting short-term support levels to the test.
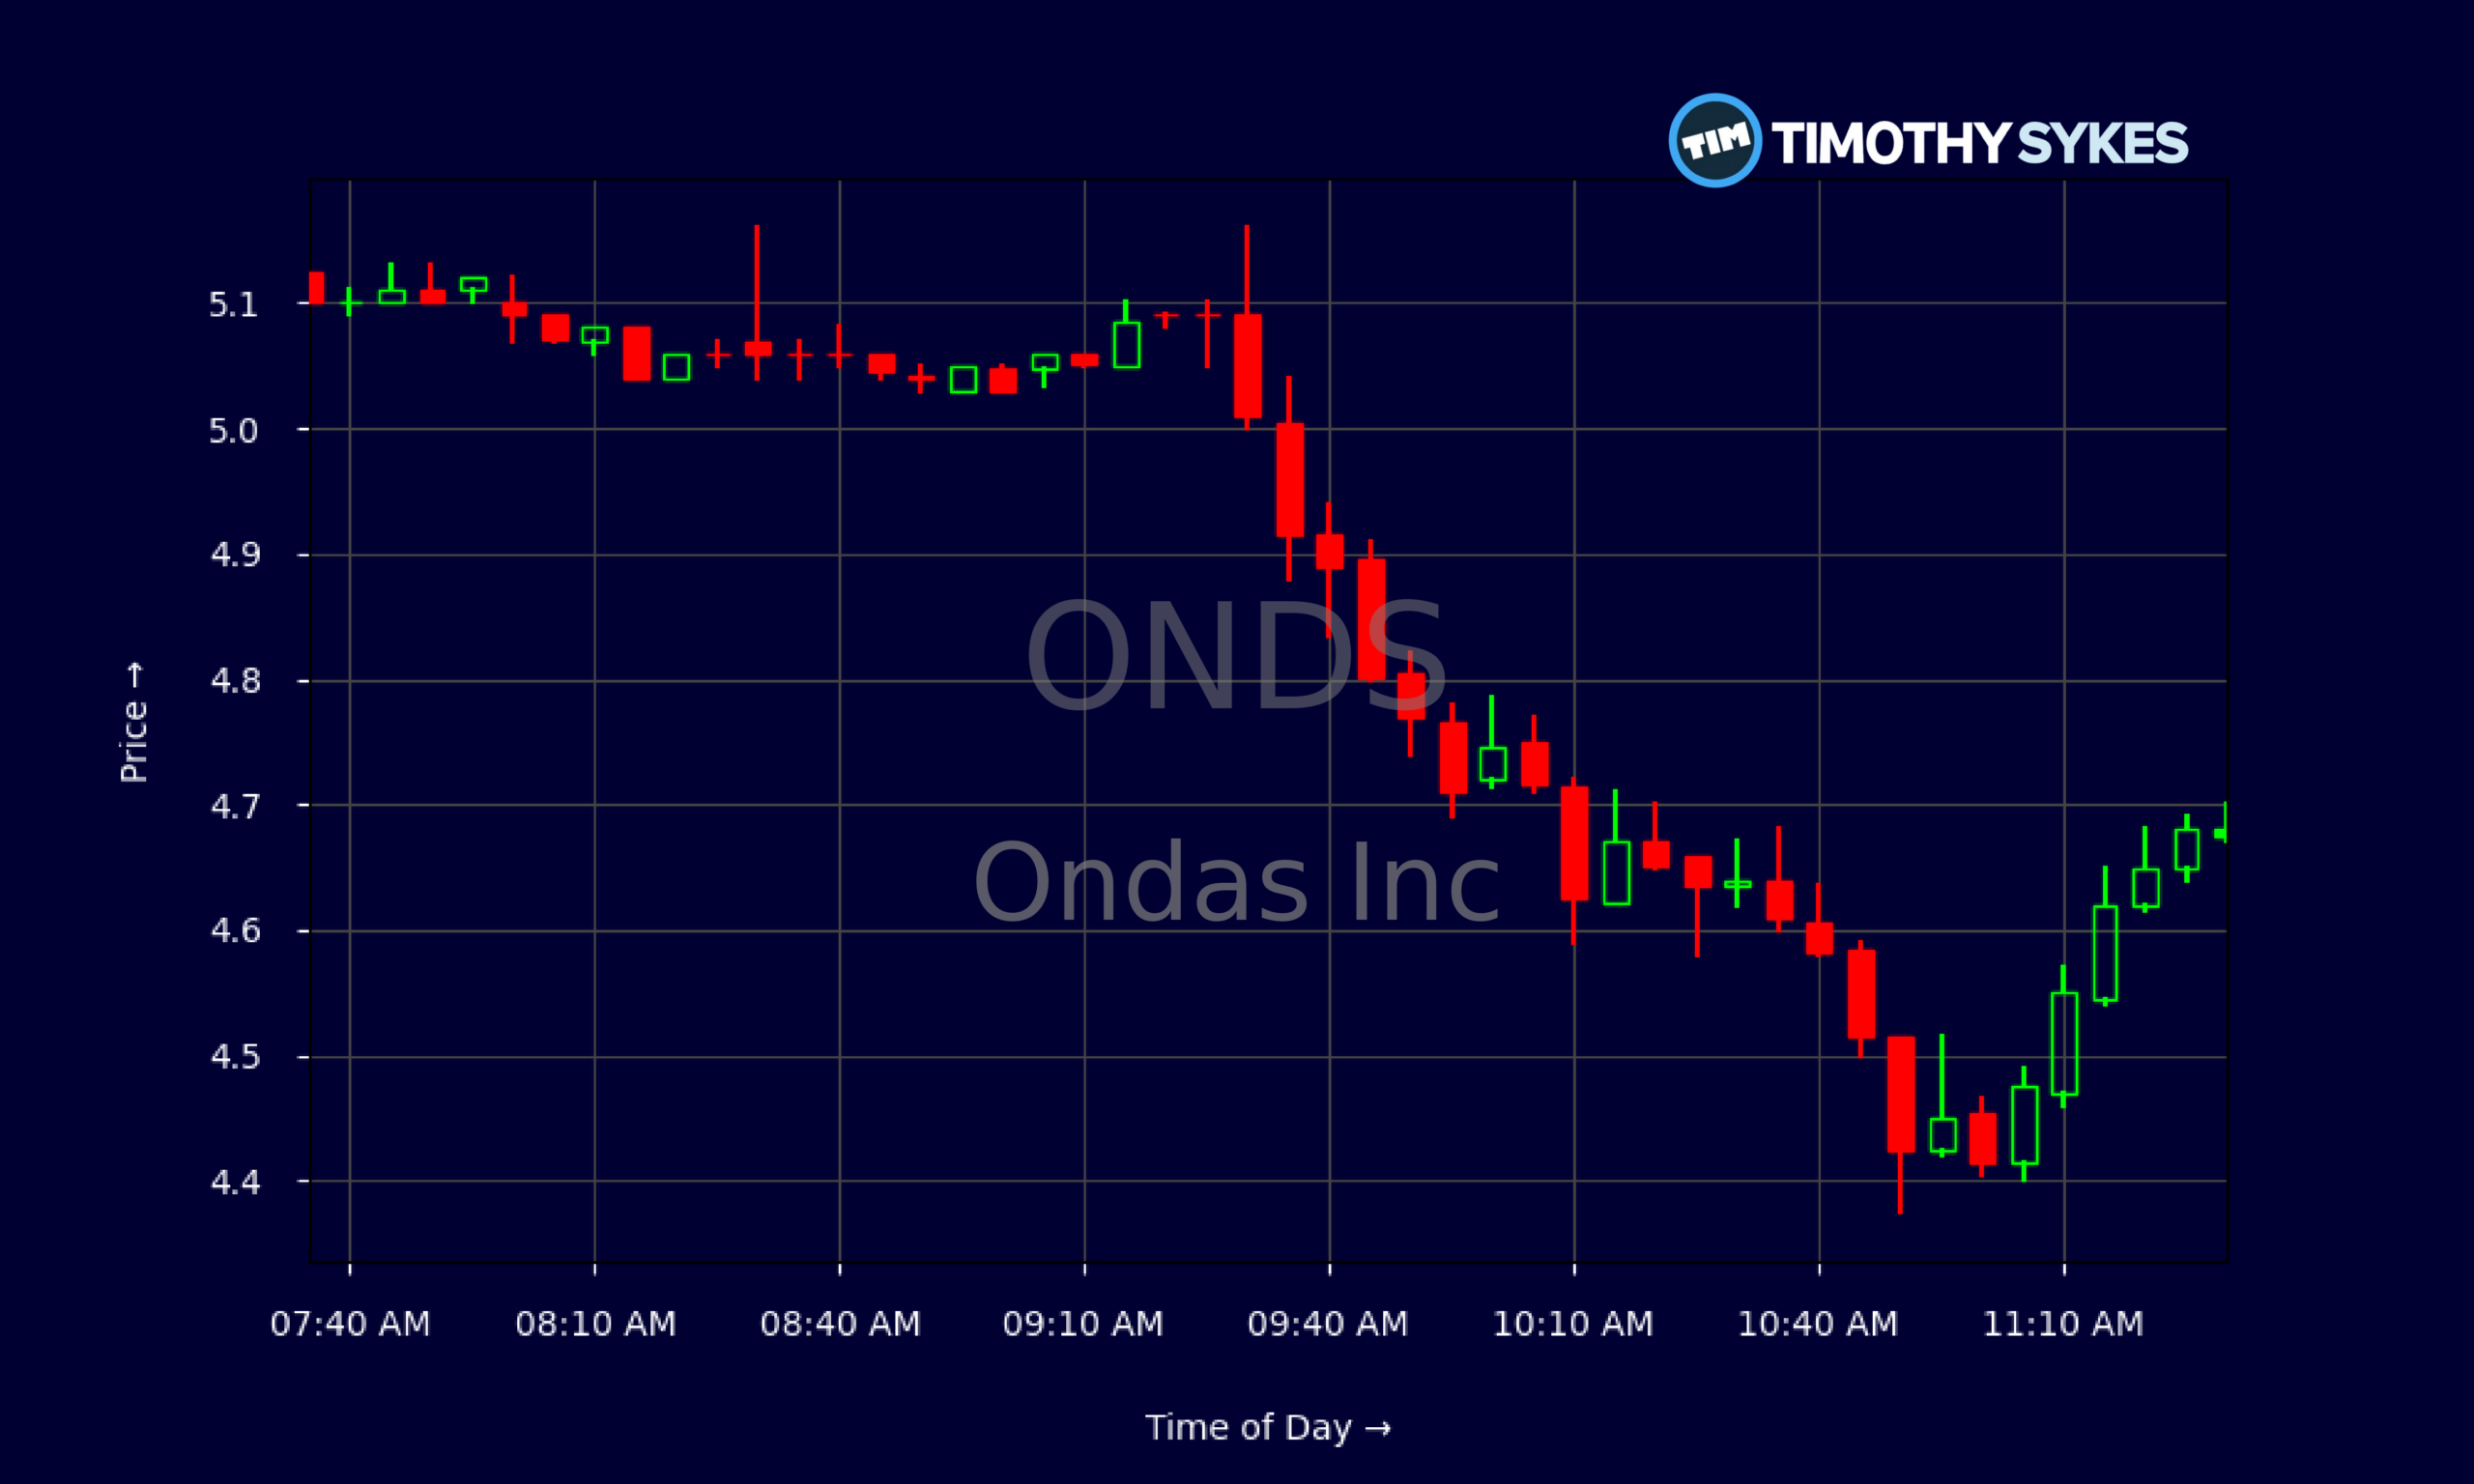
- Intraday action in ONDS shows a steady fade from the $5.10 premarket area down toward $4.40, signaling clear selling pressure.
- Ondas Inc’s latest quarterly report shows strong revenue growth but heavy losses and negative free cash flow, a classic high‑risk, high‑reward setup.
- ONDS carries low debt, high cash, and a rich price‑to‑sales ratio, suggesting plenty of runway but also a premium valuation.
- Traders in ONDS are focused on whether this correction is just profit‑taking or the start of a deeper downtrend.
Live Update At 11:33:18 EST: On Thursday, November 05, 2026 Ondas Inc stock [NASDAQ: ONDS] is trending down by -11.2%! Discover the key drivers behind this movement as well as our expert analysis in the detailed breakdown below.
Quick Financial Overview
Ondas Inc, trading under ticker ONDS, sits in that tricky zone many growth names know well: strong top‑line expansion, heavy spending, and a market that demands proof. The latest report shows total revenue of about $83.8M for the quarter, with revenue growth over 3 years above 160%. ONDS is clearly scaling.
But the cost of that growth is steep. Ondas Inc printed a quarterly net loss near $88M and an operating loss of about $144M. Free cash flow was roughly -$93.8M, and operating cash flow was negative as well. For traders, that means ONDS is burning cash to build its business.
The balance sheet, though, gives Ondas Inc room to maneuver. ONDS shows around $1.38B in cash, cash equivalents, and short‑term investments, current assets of about $1.61B, and current liabilities of only $163M. Debt is tiny: long‑term debt is roughly $4.1M, and current debt is about $2.3M. That translates into a strong current ratio near 10, minimal leverage, and a long runway to keep funding losses.
More Breaking News
Valuation is not cheap. ONDS trades at roughly 22.5 times sales and about 2.5 times book value, signaling traders are paying up for growth and future potential.
Why Traders Are Watching ONDS Price Action
The chart tells a blunt story. Over the last several sessions, ONDS has slid from the $7 area down to a recent close near $4.69. That’s a sharp pullback from the 10/12 high around $7.08 and a series of lower highs: $6.88, $6.86, $6.65, then down through the low‑6s. For short‑term traders, Ondas Inc is now clearly in a downtrend on the daily chart.
Intraday, ONDS started the regular session near $5.09, pushed briefly to $5.16, then sold off nearly all morning. Candles from 09:35 through late morning show consistent lower highs and lower lows, with price drifting from the low‑$5s to the mid‑$4.40s before stabilizing around $4.65–$4.70. That kind of steady fade with no real bounce screams distribution, not healthy consolidation.
At the same time, ONDS still trades far above where many slower, cash‑burning names sit because Ondas Inc’s balance sheet is loaded with liquidity and almost no debt. Traders willing to hunt volatility see a speculative playground: big revenue growth, high margins on paper, and a strong cash cushion, but massive losses and negative cash flow.
For momentum traders, the key question is whether ONDS finds a firm base above prior support in the mid‑$4s or cracks and heads for a full round‑trip of its earlier run. A clean reclaim of $5 with volume would suggest shorts taking profits and dip buyers stepping in. Continued rejection near that zone would confirm bears still control the tape.
Conclusion
Ondas Inc is a classic battleground name right now. ONDS shows powerful revenue growth, a fat cash pile, and minimal debt, yet the company is burning tens of millions in cash each quarter and trading at a rich price‑to‑sales multiple. The market has started to question that premium, and the chart reflects it with a firm trend from $7 down toward the mid‑$4s.
For short‑term traders, ONDS is all about levels and discipline. The intraday breakdown from $5+ to the $4.40–$4.70 zone sets clear reference points. A sustained push back over $5 with rising volume would signal bulls trying to regain control. A clean break under the recent low would open the door to more downside and force late longs to reconsider.
The bigger picture is simple: Ondas Inc has time and cash, but not unlimited patience from the market. ONDS needs to show progress on narrowing losses to justify that 20x‑plus sales tag. Until then, it remains a trading vehicle, not a comfort hold. As millionaire penny stock trader and teacher Tim Sykes, says, “You must adapt to the market; the market will not adapt to you.”. That mindset is crucial here, because ONDS can remain volatile and extended far longer than stubborn traders can remain solvent.
As Tim Sykes loves to say, “Trade the price action, not the story.” ONDS is giving traders plenty of price action. The job now is to stay prepared, cut losses fast, and let the chart tell the truth.
This is stock news, not investment advice. Timothy Sykes News delivers real-time stock market news focused on key catalysts driving short-term price movements. Our content is tailored for active traders and investors seeking to capitalize on rapid price fluctuations, particularly in volatile sectors like penny stocks. Readers come to us for detailed coverage on earnings reports, mergers, FDA approvals, new contracts, and unusual trading volumes that can trigger significant short-term price action. Some users utilize our news to explain sudden stock movements, while others rely on it for diligent research into potential investment opportunities.
Dive deeper into the world of trading with Timothy Sykes, renowned for his expertise in penny stocks. Explore his top picks and discover the strategies that have propelled him to success with these articles:
- Penny Stocks Trading Guide
- Best Penny Stocks Under $1 to Buy Today
- Top 8 Penny Stocks to Watch on Robinhood
Once you’ve got some stocks on watch, elevate your trading game with StocksToTrade the ultimate platform for traders. With specialized tools for swing and day trading, StocksToTrade will guide you through the market’s twists and turns.
Dig into StocksToTrade’s watchlists here:





Leave a reply