

Leverage Shares 2X Long SPCX Daily ETF stocks have been trading down by -7.82 percent amid souring sentiment on SPAC-focused funds.
Key Takeaways
- Leverage Shares 2X Long SPCX Daily ETF (SPCH) has faded from an 11.78 recent high to the mid-$7s, showing a heavy multi-day downtrend.
- Intraday action in SPCH is choppy, with sharp morning swings followed by midday consolidation, signaling active short-term trading interest.
- SPCH’s leveraged structure is amplifying moves in its underlying holdings, turning each pullback into a steeper slide.
- Recent closes show SPCH repeatedly failing to hold pops above $9, a clear area where profit-taking has been strong.
- Traders are focusing on risk management in SPCH, as 2X leverage magnifies both gains and losses on quick momentum shifts.
Live Update At 11:32:32 EST: On Wednesday, November 04, 2026 Leverage Shares 2X Long SPCX Daily ETF stock [BATS Global Markets: SPCH] is trending down by -7.82%! Discover the key drivers behind this movement as well as our expert analysis in the detailed breakdown below.
Quick Financial Overview
Leverage Shares 2X Long SPCX Daily ETF, trading under the SPCH ticker, is a leveraged product tied to a basket of high-growth, early-stage companies. That leverage is front and center in the recent chart. SPCH topped out near 11.78 on 2026/10/12 and has been bleeding lower ever since, closing at 7.685 on 2026/11/04. That’s a steep drawdown in a few weeks, and traders feel every tick.
Because SPCH is designed to deliver roughly twice the daily move of its underlying exposure, normal market dips can turn into sharp air pockets. The daily candles show that clearly. After several sessions around $10–$11, SPCH failed to hold those levels and slid through $9, then $8, with only brief bounces.
More Breaking News
Fundamental ratios for SPCH aren’t very helpful, since this is an ETF rather than a single operating company. There is no standard revenue line or profit margin to lean on. For traders, SPCH is all about price action, liquidity, and how closely it tracks the leveraged benchmark day to day. When volatility picks up in speculative names, that volatility tends to be multiplied inside SPCH.
Why Traders Are Watching SPCH Price Action
The SPCH chart reads like a case study in why traders need a plan when dealing with leverage. From 2026/10/12 to 2026/10/22, SPCH slid from 11.78 down to 8.84. That’s a large percentage move in a short window, even by small-cap standards. Each failed bounce near $10 and later around $9.50 shows supply waiting overhead, with traders selling into strength rather than chasing higher.
Over the next stretch — late October into early November — SPCH kept grinding lower, with closes of 9.53, 9.18, 9.43, 9.405, then a quick spike to 10.84 on 2026/10/21, followed by a sharp drop to 8.84 the next day. That single-day round trip highlights how SPCH amplifies intraday sentiment swings. When there’s a rush into speculative growth names, SPCH can pop hard. When that enthusiasm fades, it unwinds just as fast.
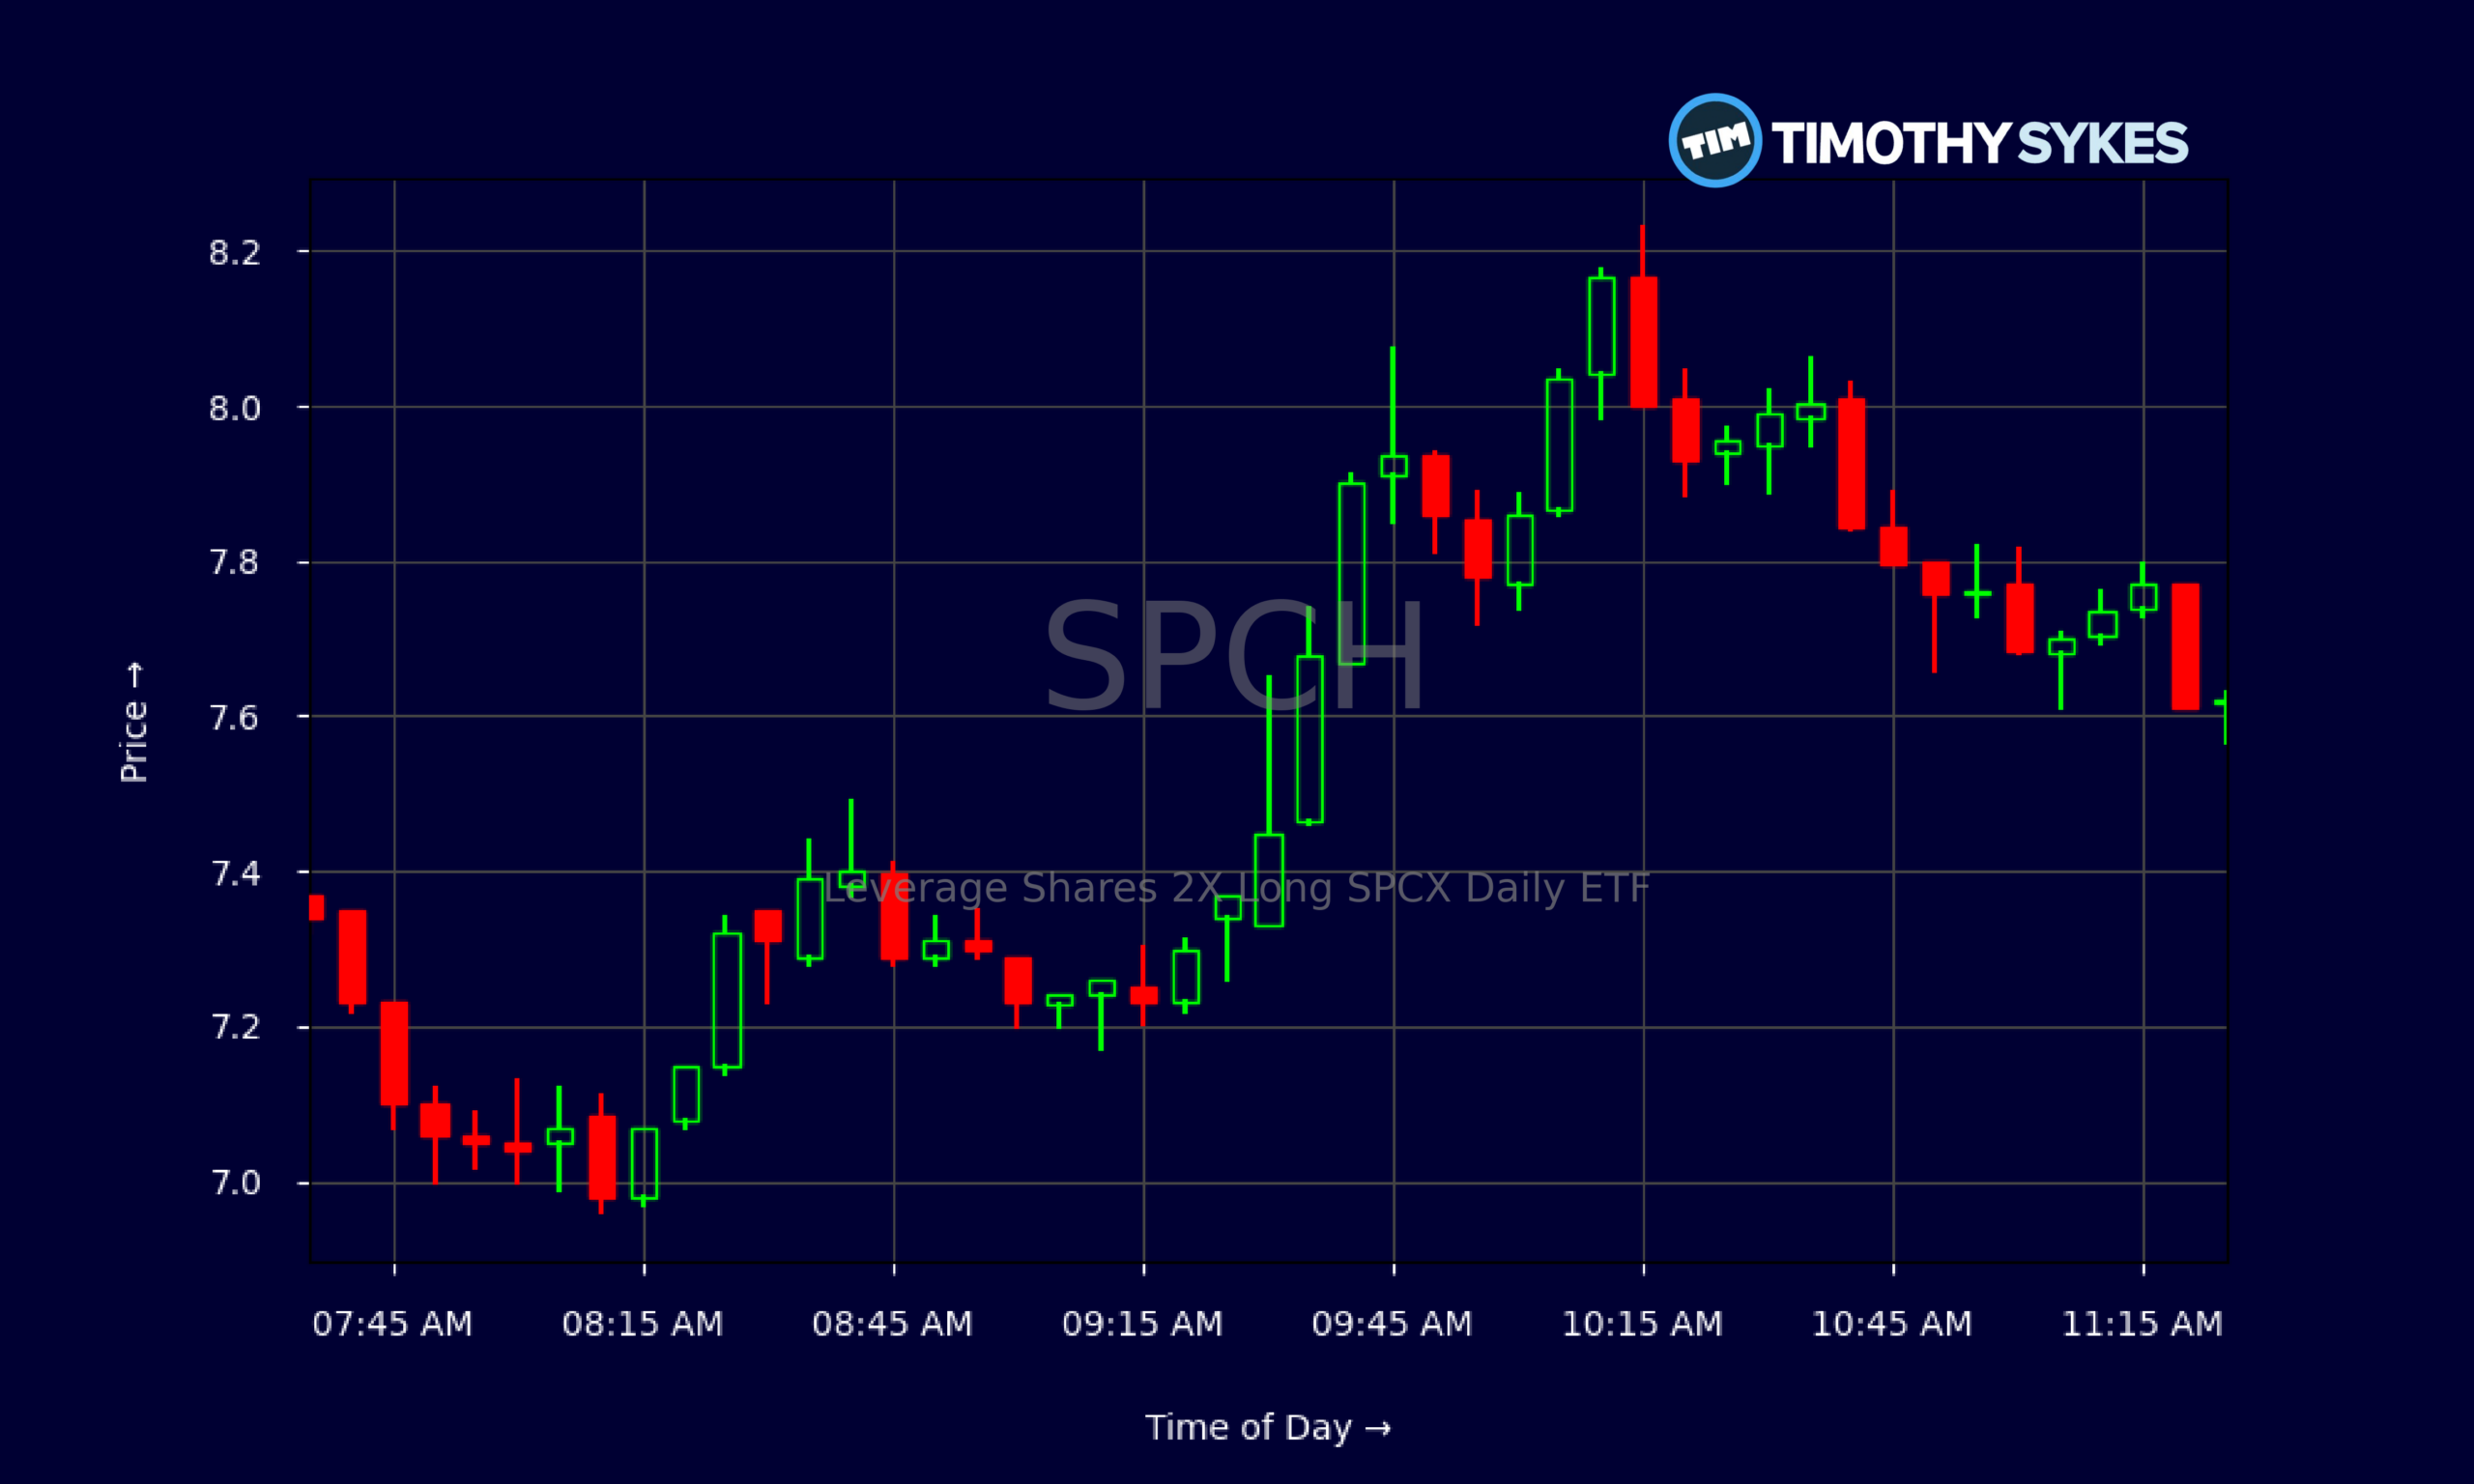
The latest candles tell a story of fatigue. On 2026/11/04, SPCH opened at 7.33, ripped to 8.23, then faded to close at 7.685. The intraday 5‑minute chart backs this up: strong premarket and opening drive, then a series of lower highs from around 8.23 down into the high‑7s. For active traders, this is classic “sell the rips” action.
SPCH keeps attracting day traders because of this volatility. The ETF gives clean trends, clear levels, and strong range. But that same action punishes anyone who overstays or ignores a stop. In SPCH, one bad hold can erase several good trades.
Conclusion
SPCH has moved from a strong uptrend to a decisive downtrend, and the charts are brutally honest about that shift. Leverage that once made SPCH fun on the way up is now pushing the ETF lower at a faster clip than its underlying holdings. Price has broken below past support zones in the $9–$10 range, and recent action around 7.50–8 shows hesitant bounces getting sold.
For short-term traders, SPCH still offers opportunity. The 5‑minute chart shows wide intraday ranges, with $0.50–$1 swings that can be traded if you’re disciplined. SPCH’s behavior around the mid‑$7s will matter; hold and base there, and a snapback toward $8.50–$9 is possible. Lose that area with volume, and momentum traders may press the downside again.
The bigger lesson with SPCH is timeless. Leverage is a tool, not a gift. As Tim Sykes likes to say, “Volatility is your best friend and your worst enemy — it all depends on whether you have a plan and stick to it.” As millionaire penny stock trader and teacher Tim Sykes, says, “Consistency is key in trading; don’t let emotions dictate your trades.”. Traders studying SPCH should treat every entry, every exit, and every risk level with that mindset. This ETF rewards preparation and punishes hope.
This is stock news, not investment advice. Timothy Sykes News delivers real-time stock market news focused on key catalysts driving short-term price movements. Our content is tailored for active traders and investors seeking to capitalize on rapid price fluctuations, particularly in volatile sectors like penny stocks. Readers come to us for detailed coverage on earnings reports, mergers, FDA approvals, new contracts, and unusual trading volumes that can trigger significant short-term price action. Some users utilize our news to explain sudden stock movements, while others rely on it for diligent research into potential investment opportunities.
Dive deeper into the world of trading with Timothy Sykes, renowned for his expertise in penny stocks. Explore his top picks and discover the strategies that have propelled him to success with these articles:
- Penny Stocks Trading Guide
- Best Penny Stocks Under $1 to Buy Today
- Top 8 Penny Stocks to Watch on Robinhood
Once you’ve got some stocks on watch, elevate your trading game with StocksToTrade the ultimate platform for traders. With specialized tools for swing and day trading, StocksToTrade will guide you through the market’s twists and turns.
Dig into StocksToTrade’s watchlists here:





Leave a reply