

Nu Holdings Ltd. faces intensified regulatory scrutiny, and its stocks have been trading down by -22.1 percent.
Key Takeaways
- NU is holding above recent support after a strong multi‑week run on the daily chart.
- Intraday NU action shows tight consolidation, a sign that traders are waiting for the next directional move.
- Nu Holdings Ltd. reports more than $16.1B in cash, backing up its aggressive digital banking push.
- Valuation on NU remains rich versus book value, so momentum and risk management matter for short‑term trading.
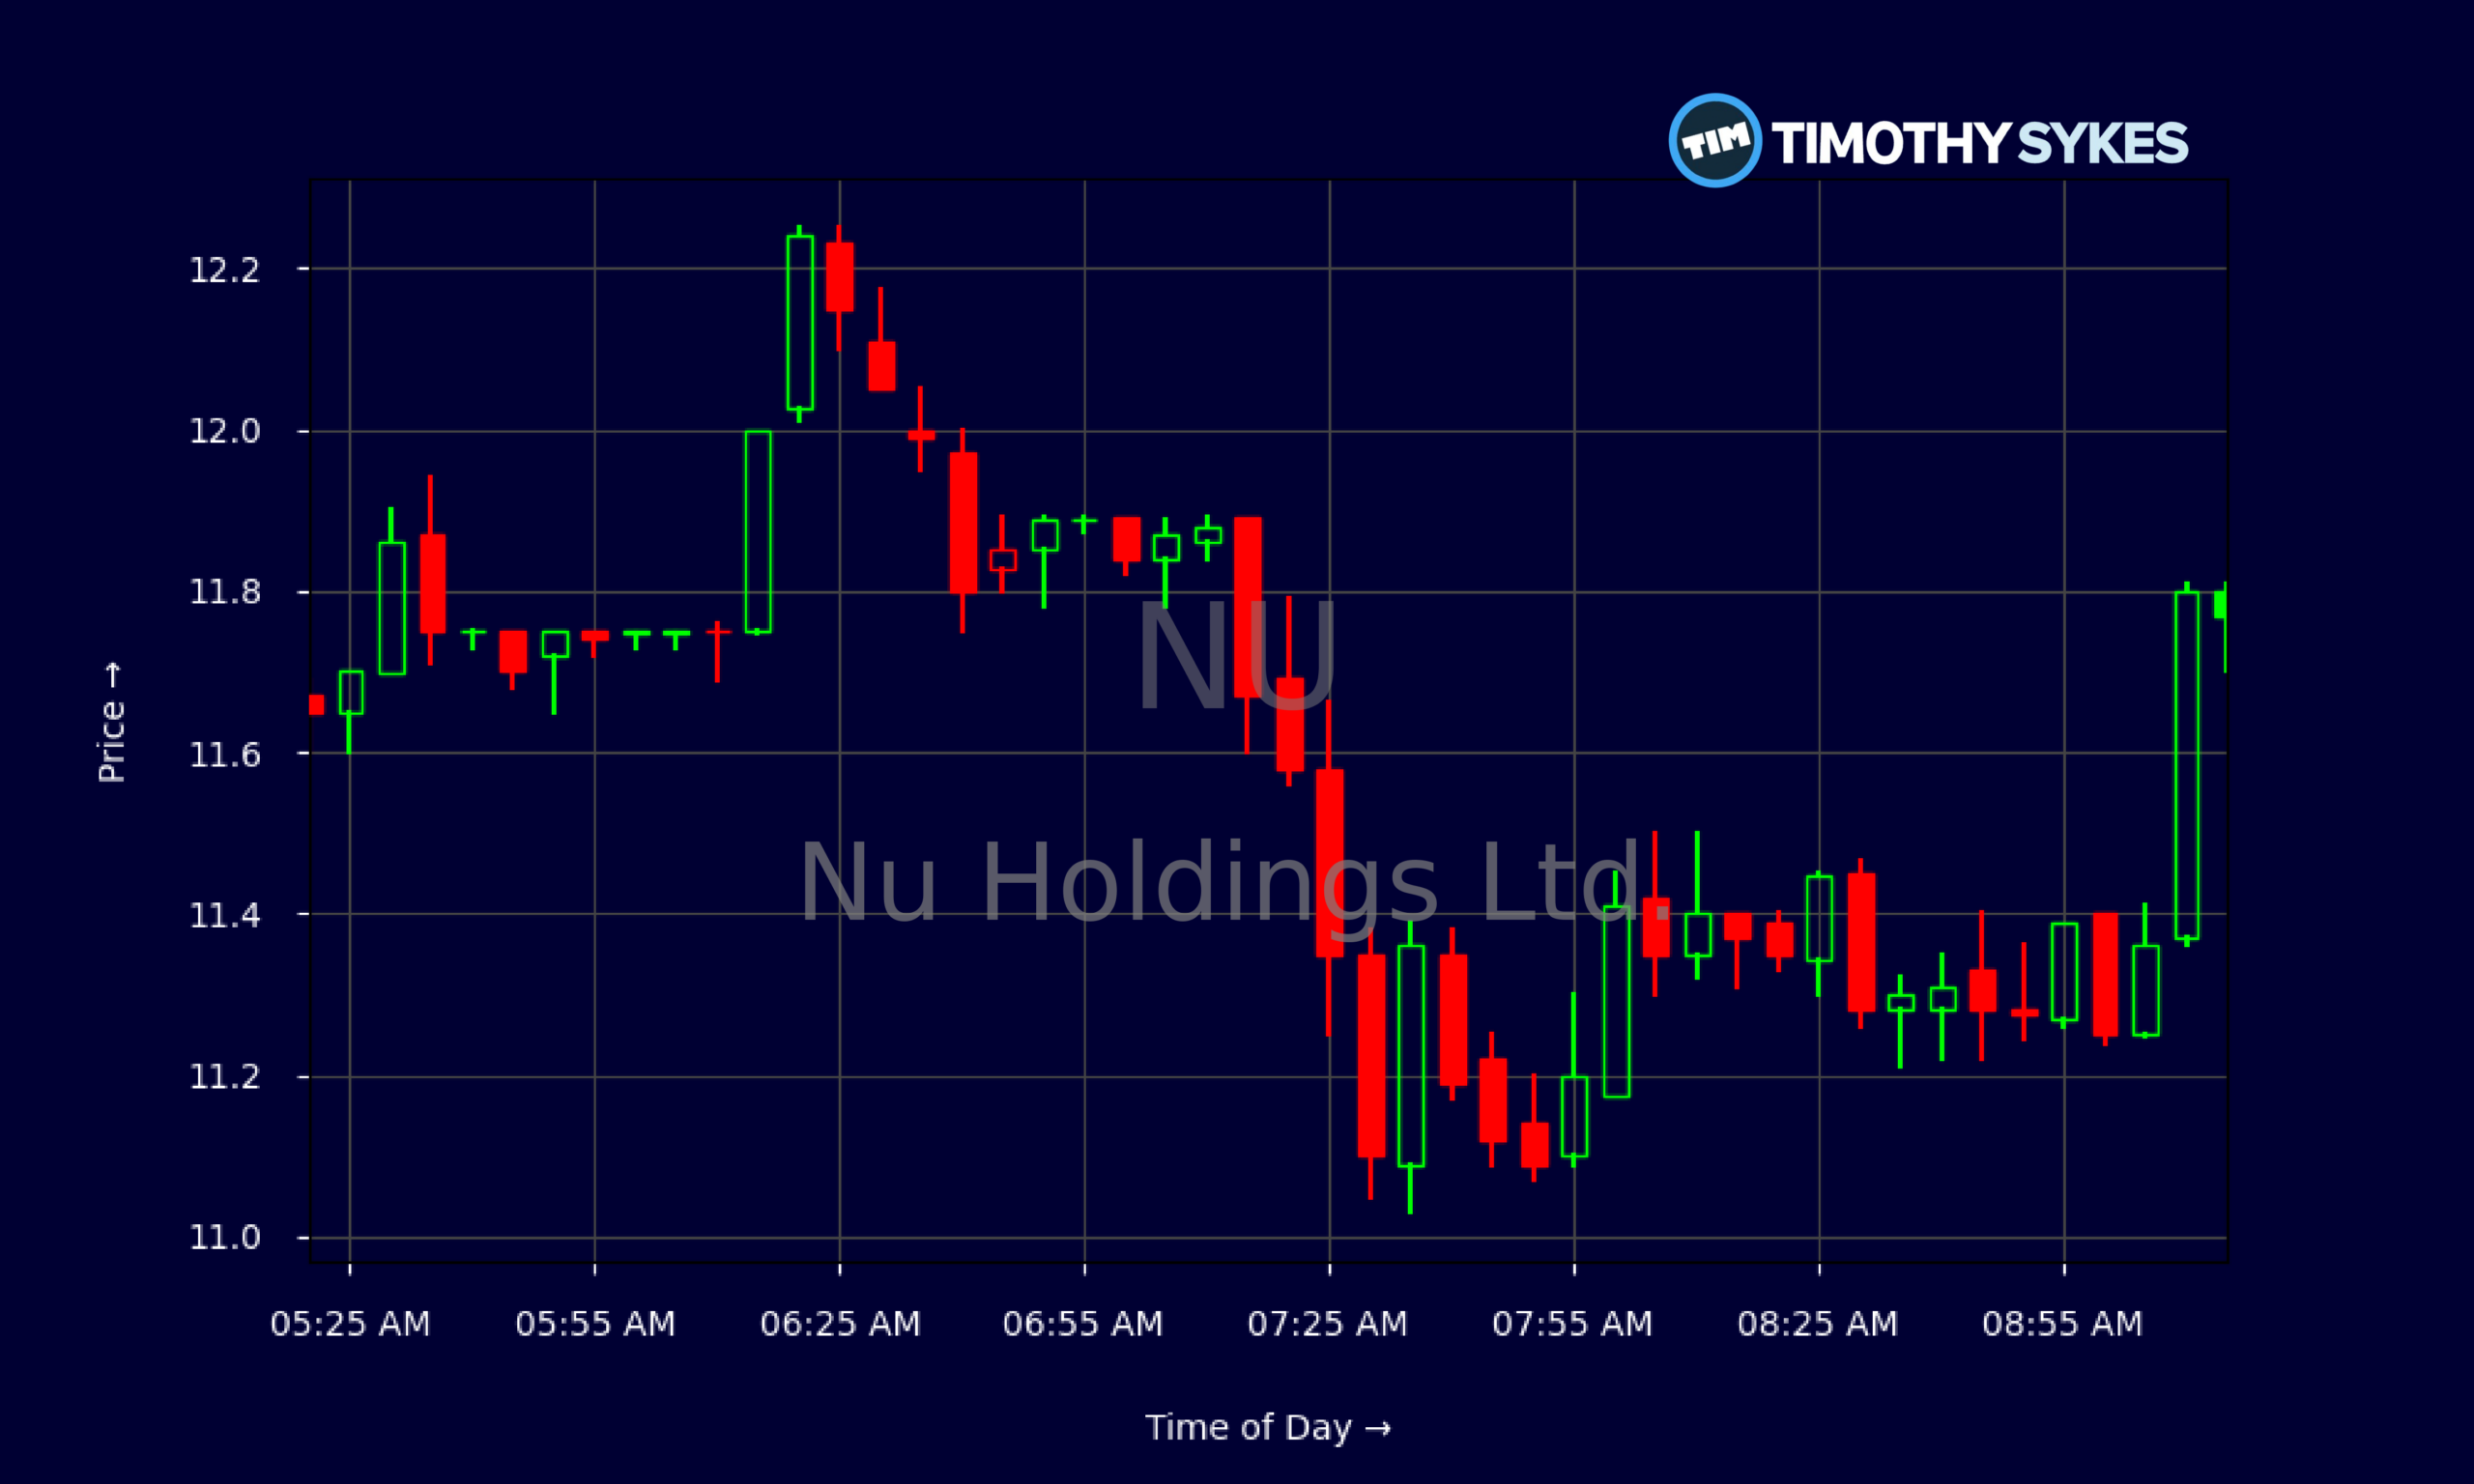
Live Update At 09:19:04 EDT: On Monday, October 26, 2026 Nu Holdings Ltd. stock [NYSE: NU] is trending down by -22.1%! Discover the key drivers behind this movement as well as our expert analysis in the detailed breakdown below.
Quick Financial Overview
NU has turned itself into one of the most watched fintech names in Latin America, and the numbers back up why traders keep coming back to this ticker. Nu Holdings Ltd. generated about $10.16B in revenue, which is solid scale for a relatively young digital bank. Yet NU still shows a pretax profit margin of around ‑5.6%, so the business is not fully dialed in on profitability. That mix — big top line, thin or negative margins — is classic high‑growth fintech.
On the balance sheet, NU stands out. Nu Holdings Ltd. holds roughly $16.14B in cash and cash equivalents against total assets near $74.89B. Total equity sits around $11.29B, which supports Nu Holdings Ltd.’s push into more lending and cross‑selling inside its app. The leverage ratio of 6.6 tells traders NU is using its balance sheet aggressively, as most banks do, but not recklessly for a scaled financial platform.
More Breaking News
Valuation is rich. NU trades at roughly 7.7 times sales and about 6.9 times book value, while book value per share is just $2.33. For traders, that means NU is a momentum and execution story. When Nu Holdings Ltd. shows progress on margins, the market tends to reward it fast — and punish it just as fast when growth wobbles.
Why Traders Are Watching NU’s Price Action
Strip away the noise and the NU chart tells a straightforward story: this is an uptrend taking a breather. On the daily chart, NU climbed from the low‑$13s (around 26/10/01–26/10/02) to recent closes above $15, topping near $16.12–$16.19 in mid‑month. That’s a strong multi‑day run of about 20% from the early‑month base, with Nu Holdings Ltd. now digesting gains between roughly $14.5 and $16.
Over the last several days, NU has held higher lows. Pullbacks toward $14.5–$14.7 have found buyers, while spikes toward $15.5–$16 have brought in profit‑taking. That stair‑step pattern shows accumulation under the surface. Nu Holdings Ltd. is not blasting to fresh highs every day, but sellers are not taking control either.
The intraday 5‑minute action backs that up. Overnight and pre‑market, NU swung between roughly $11.7 and $12.3 on this data snapshot, then tightened into the $11.7–$11.9 range. For active traders, that kind of narrowing range signals a coiled spring. Nu Holdings Ltd. is seeing both dip buyers and early sellers meet in the middle.
Traders watching NU now focus on two ideas. First, whether Nu Holdings Ltd. can hold the recent daily support zone around the mid‑$14s. Second, whether fresh volume shows up when NU re‑tests the mid‑$15s. A high‑volume break above the recent $16 area would confirm trend continuation. A crack below support with heavy selling would tell short‑biased traders it’s finally time to press.
Conclusion
NU sits at the crossroads of growth story and trading vehicle, which is exactly where short‑term traders love to hunt. Nu Holdings Ltd. is scaling fast, but profitability is still catching up, and the market is charging a premium price for that growth. Those ingredients create the big swings that day traders and swing traders look for. NU’s rich price‑to‑sales and price‑to‑book ratios also mean expectations are high; any stumble and the stock can retrace quickly.
Technically, NU remains in an uptrend, with Nu Holdings Ltd. consolidating gains after a sharp push off the low‑$13s. That consolidation gives traders clean levels to plan around. Breakouts above recent highs can offer momentum plays, while failed bounces toward resistance can set up short trades, all with clearly defined risk.
The key is discipline. NU will reward traders who map their levels and stick to their plans, not those who chase every tick. As millionaire penny stock trader and teacher Tim Sykes says, “Preparation plus patience leads to big profits.”. Tim Sykes puts it simply: “The market doesn’t owe you anything — you earn your profits by cutting losses fast and only trading the best setups.” For NU, that means waiting for Nu Holdings Ltd. to show its hand — then trading the move, not the hype. This analysis is for educational and research purposes only, and every trader must decide for themselves how, or if, NU fits their own strategy.
This is stock news, not investment advice. Timothy Sykes News delivers real-time stock market news focused on key catalysts driving short-term price movements. Our content is tailored for active traders and investors seeking to capitalize on rapid price fluctuations, particularly in volatile sectors like penny stocks. Readers come to us for detailed coverage on earnings reports, mergers, FDA approvals, new contracts, and unusual trading volumes that can trigger significant short-term price action. Some users utilize our news to explain sudden stock movements, while others rely on it for diligent research into potential investment opportunities.
Dive deeper into the world of trading with Timothy Sykes, renowned for his expertise in penny stocks. Explore his top picks and discover the strategies that have propelled him to success with these articles:
- Penny Stocks Trading Guide
- Best Penny Stocks Under $1 to Buy Today
- Top 8 Penny Stocks to Watch on Robinhood
Once you’ve got some stocks on watch, elevate your trading game with StocksToTrade the ultimate platform for traders. With specialized tools for swing and day trading, StocksToTrade will guide you through the market’s twists and turns.
Dig into StocksToTrade’s watchlists here:





Leave a reply