

Companhia de Saneamento Básico do Estado de São Paulo – Sabesp stocks have been trading up by 8.45 percent after privatization progress news.
What Traders Need To Know
- Recent weekly candles show Companhia de saneamento Basico Do Estado De Sao Paulo – Sabesp holding a steady grind higher, with the latest push from $6.23 to $6.80.
- Intraday action around $6.40 shows tight trading ranges, hinting at consolidation after the recent pop.
- A price-to-earnings ratio near 14 and price-to-sales around 3.2 place SBS in a mid-range valuation zone for a regulated utility-style name.
- Balance sheet data shows heavy long-term debt but solid equity, giving traders a leveraged, yet asset-backed, story.
- Dividend yield above 0.5% adds a small income kicker, but this is mainly a price-action and margin story for short-term traders.
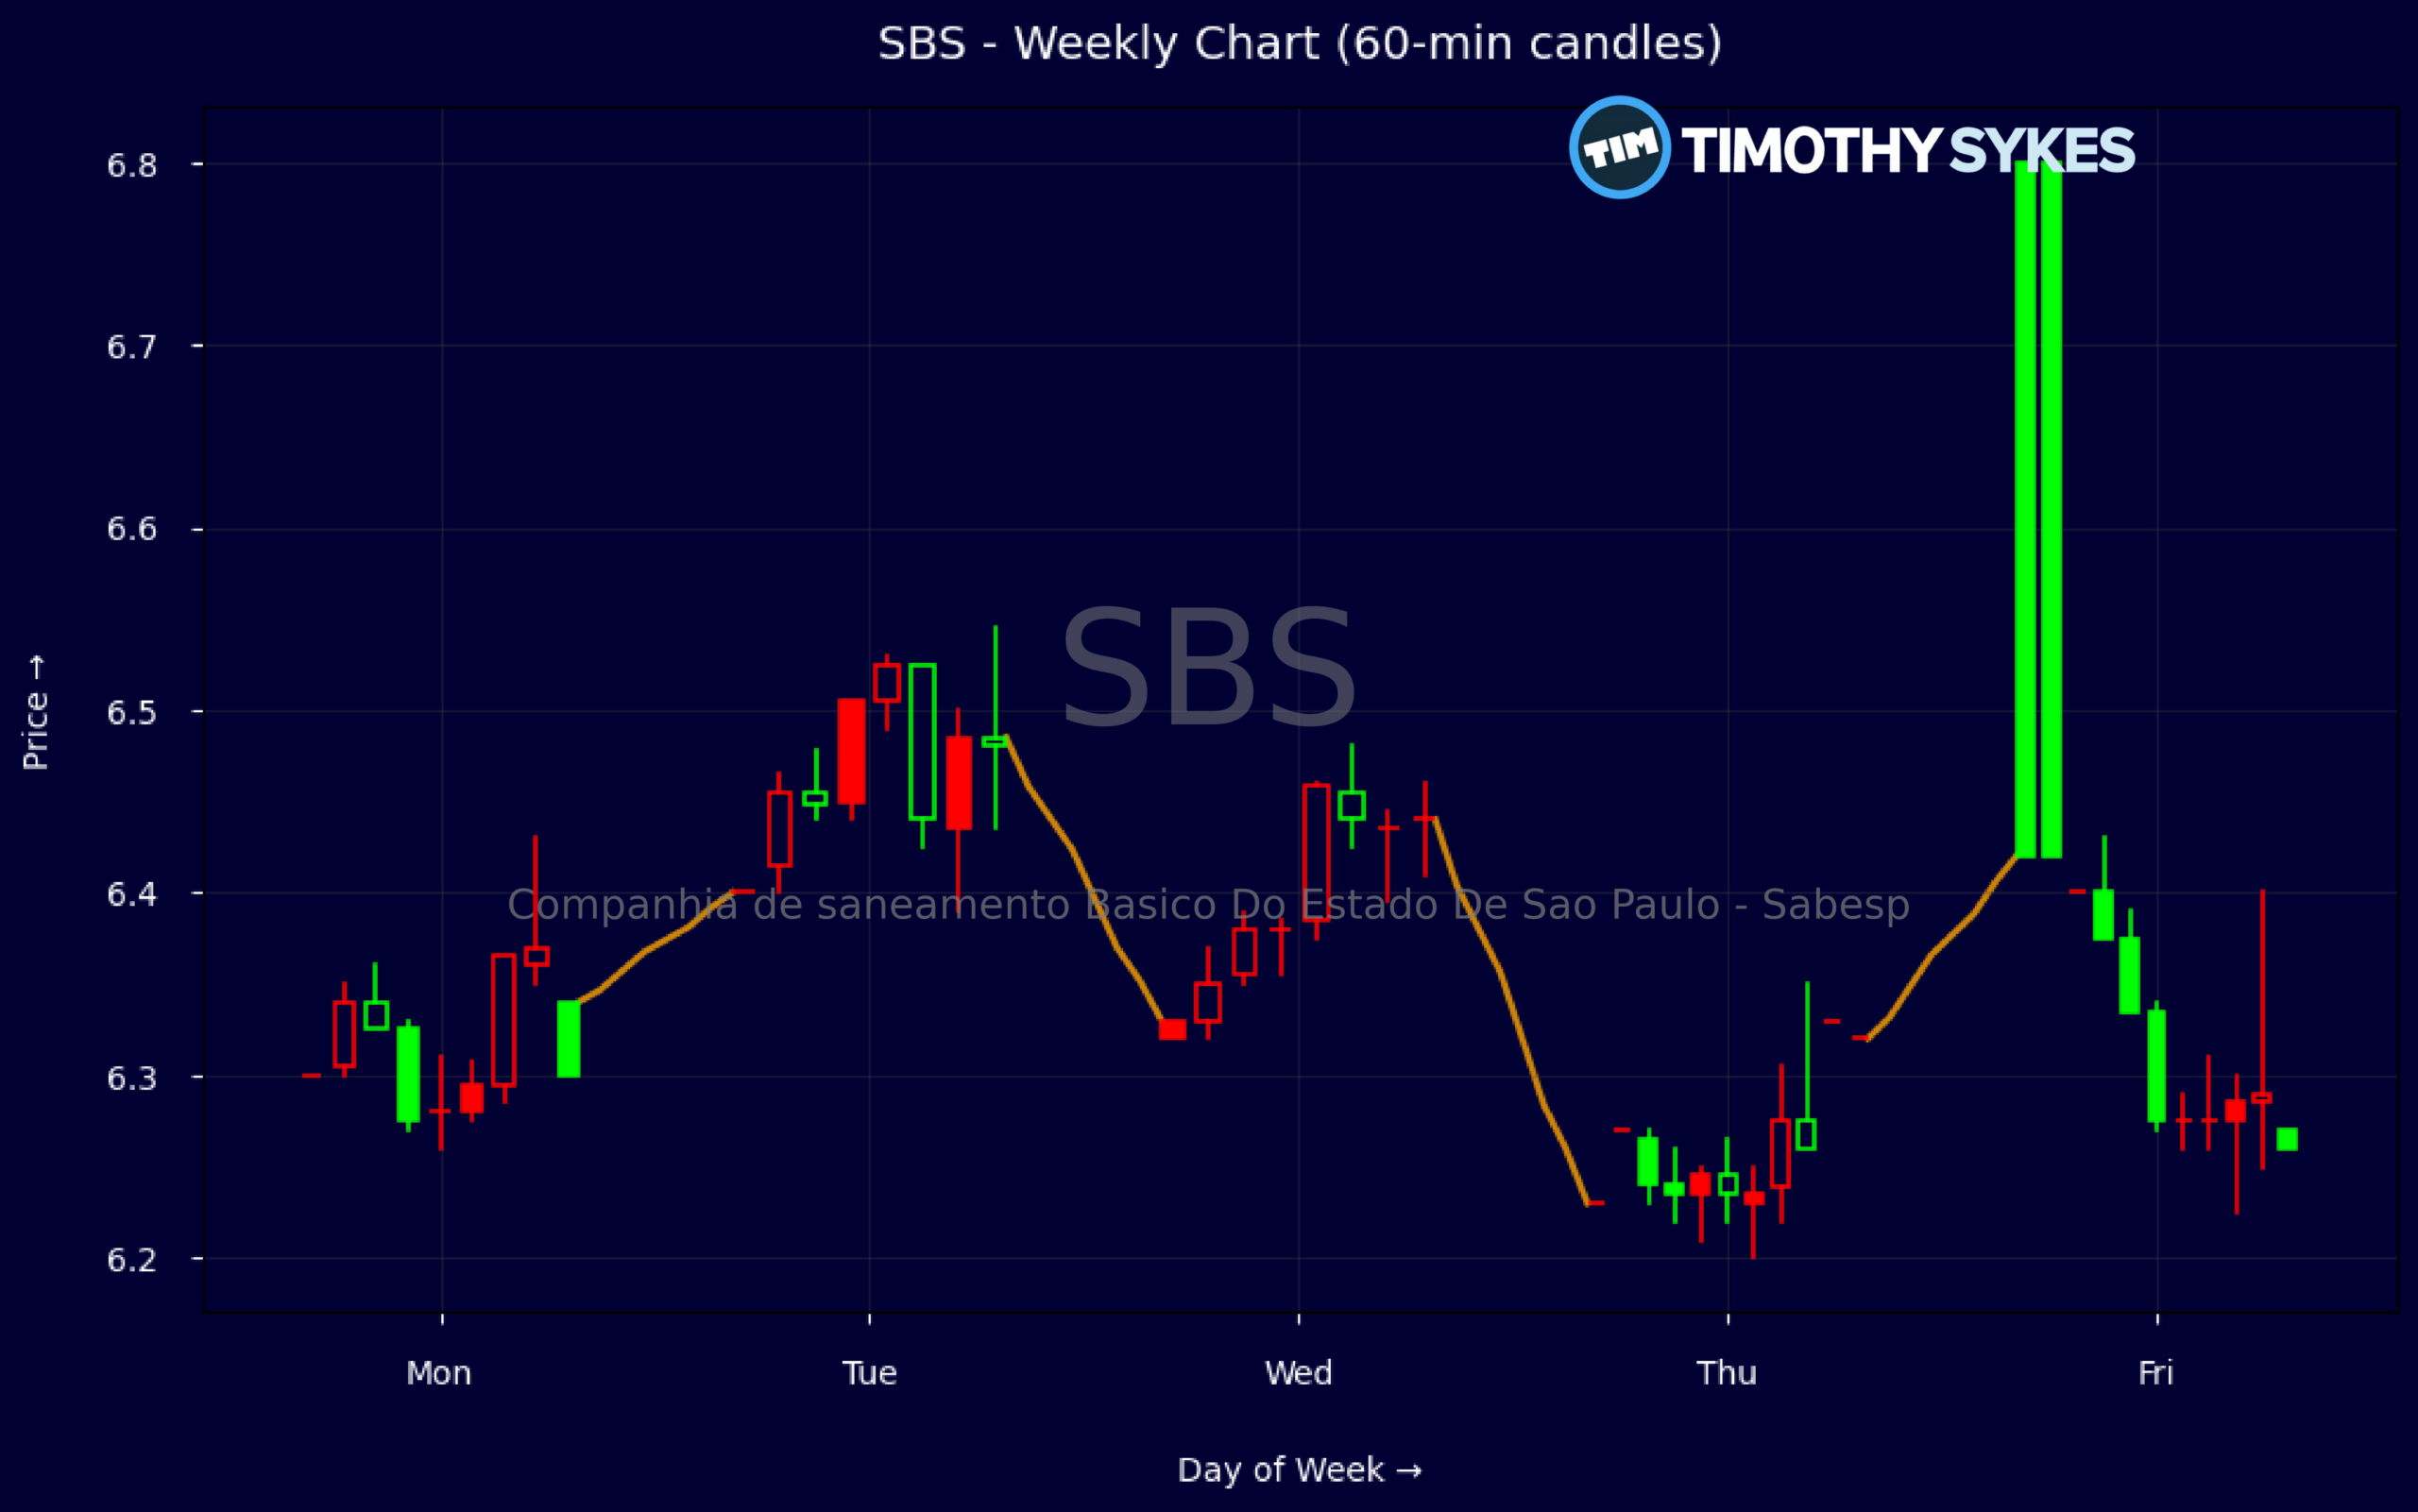
Weekly Update Oct 19 – Oct 23, 2026: On Sunday, October 25, 2026 Companhia de saneamento Basico Do Estado De Sao Paulo – Sabesp stock [NYSE: SBS] is trending up by 8.45%! Discover the key drivers behind this movement as well as our expert analysis in the detailed breakdown below.
Utilities industry expert:
Analyst sentiment – positive
Companhia de Saneamento Básico do Estado de São Paulo (SBS) occupies a strong position in Brazilian regulated utilities, with a P/E of 13.97 and Price/Sales of 3.19 implying a moderate valuation premium to domestic peers given its scale and stability. Pre-tax margin of 14.7% and ROIC of 11.69% indicate solid capital efficiency for a water utility, though ROE at 3.24% reflects heavy asset intensity and large intangibles. Balance sheet leverage is manageable: long-term debt/capital at 45% and a leverage ratio of 2.5, but negative working capital and modest cash of BRL 1.68bn versus BRL 3.13bn current debt require continuous refinancing access. High goodwill and intangibles (over half of assets) make the 2.87x price-to-book more demanding, yet regulatory backing and scale justify continued institutional interest.
Weekly price data show a decisive upside breakout from a tight 6.23–6.40 consolidation into a 6.80 close, establishing a short-term bullish trend. The 6.20–6.25 zone is now the primary support, aligning with prior lows and likely volume congestion from recent sessions. Intraday 5-minute candles (not shown numerically but implied by the breakout) suggest strong buying into the close, confirming momentum rather than a simple short-covering spike. For active traders, 6.25 is a clear tactical buy zone with a tight stop below 6.15, while upside focus should be on a first target around 7.10 where prior supply is likely to emerge.
With no new company-specific news, the thesis rests on regulatory stability, gradual tariff adjustments, and macro conditions in Brazil. Versus global Utilities and Regulated Utilities benchmarks, SBS offers higher regulatory and FX risk but superior growth optionality and a more attractive earnings multiple. Given ROIC above the cost of capital and leverage that is elevated but controlled, risk/reward remains favorable. I assign a 12–18 month upside bias with a tactical trading range of 6.20–7.50, key support at 6.20 and resistance at 7.50; a break above 7.50 opens 8.20.
More Breaking News
Quick Financial Overview
Companhia de saneamento Basico Do Estado De Sao Paulo – Sabesp shows a stable revenue base, with about $36.1B in annual revenue and revenue per share above 10. For a utility-style name, a pretax profit margin of 14.7% is solid, telling traders the business spins dependable income off its top line. With a price-to-earnings ratio of 13.97 and price-to-sales of 3.19, SBS sits in a reasonable range where valuation is not stretched, but not deep value either.
On the balance sheet, total assets stand near $80.9B against total liabilities of about $44.0B, leaving equity around $36.9B. Long-term debt is heavy at roughly $22.1B, and current debt near $3.1B pushes working capital slightly negative. A leverage ratio of 2.5 and long-term debt-to-capital around 0.45 confirm SBS runs a geared capital structure, normal for a large utility but important for traders to respect during risk-off tape.
Technically, weekly price data show a clean progression from roughly $6.23 up to $6.80, with higher closes after a brief dip. That climb, paired with a tight intraday 5-minute bar around $6.40, suggests momentum followed by consolidation. Traders can read that as a short-term pause after a push, often a spot where either continuation or a sharp fade sets up. The mix of stable fundamentals and steady price action makes SBS a candidate for breakout or pullback trades rather than wild momentum swings.
Conclusion
Companhia de saneamento Basico Do Estado De Sao Paulo – Sabesp now trades in a zone where the chart and the fundamentals line up reasonably well. Price has pushed from the low $6.20s to $6.80 on the weekly data, then settled into a narrow range intraday around $6.40, which signals digestion rather than panic. For short-term traders, this often means the next clear move will come from a break of these nearby levels, not from a surprise shift in the story.
The financials behind SBS support that view. Solid pretax margins, a mid-teens P/E, and a sizeable asset base backstop the equity, while leverage and negative working capital keep risk real if the broader market turns defensive. As millionaire penny stock trader and teacher Tim Sykes, says, “Preparation plus patience leads to big profits.” That principle applies here, too: traders should take the time to prepare their levels and scenarios, then patiently wait for price to confirm rather than forcing a trade. Traders should focus on how price behaves around recent support near $6.20 and resistance into the $6.80 area, watching volume and tape speed for confirmation. As I tell my students, “Your edge comes from reading what the price and numbers already show you, not from guessing what might happen next.” That mindset is exactly how to approach SBS for educational and research-focused trading setups.
This is stock news, not investment advice. Timothy Sykes News delivers real-time stock market news focused on key catalysts driving short-term price movements. Our content is tailored for active traders and investors seeking to capitalize on rapid price fluctuations, particularly in volatile sectors like penny stocks. Readers come to us for detailed coverage on earnings reports, mergers, FDA approvals, new contracts, and unusual trading volumes that can trigger significant short-term price action. Some users utilize our news to explain sudden stock movements, while others rely on it for diligent research into potential investment opportunities.
Dive deeper into the world of trading with Timothy Sykes, renowned for his expertise in penny stocks. Explore his top picks and discover the strategies that have propelled him to success with these articles:
- Penny Stocks Trading Guide
- Best Penny Stocks Under $1 to Buy Today
- Top 8 Penny Stocks to Watch on Robinhood
Once you’ve got some stocks on watch, elevate your trading game with StocksToTrade the ultimate platform for traders. With specialized tools for swing and day trading, StocksToTrade will guide you through the market’s twists and turns.
Dig into StocksToTrade’s watchlists here:





Leave a reply