

NRX Pharmaceuticals Inc. faces heightened pressure as regulatory setbacks dominate sentiment, and its stocks have been trading down by -16.92 percent
Market Insights For NRXP Traders
- Price has slipped from the recent push above $3.00 toward the low-$2.00s, signaling a momentum fade that short-term traders must respect.
- Intraday action shows a sharp selloff from the $2.80s to just above $2.20, highlighting real liquidity but also aggressive selling pressure.
- Financials for NRX Pharmaceuticals Inc. show solid gross margin but extremely heavy losses and negative equity, a classic high-risk small-cap profile.
- Cash near $26.7M against deep ongoing losses gives NRXP runway, but also keeps dilution and downside volatility firmly on the table.
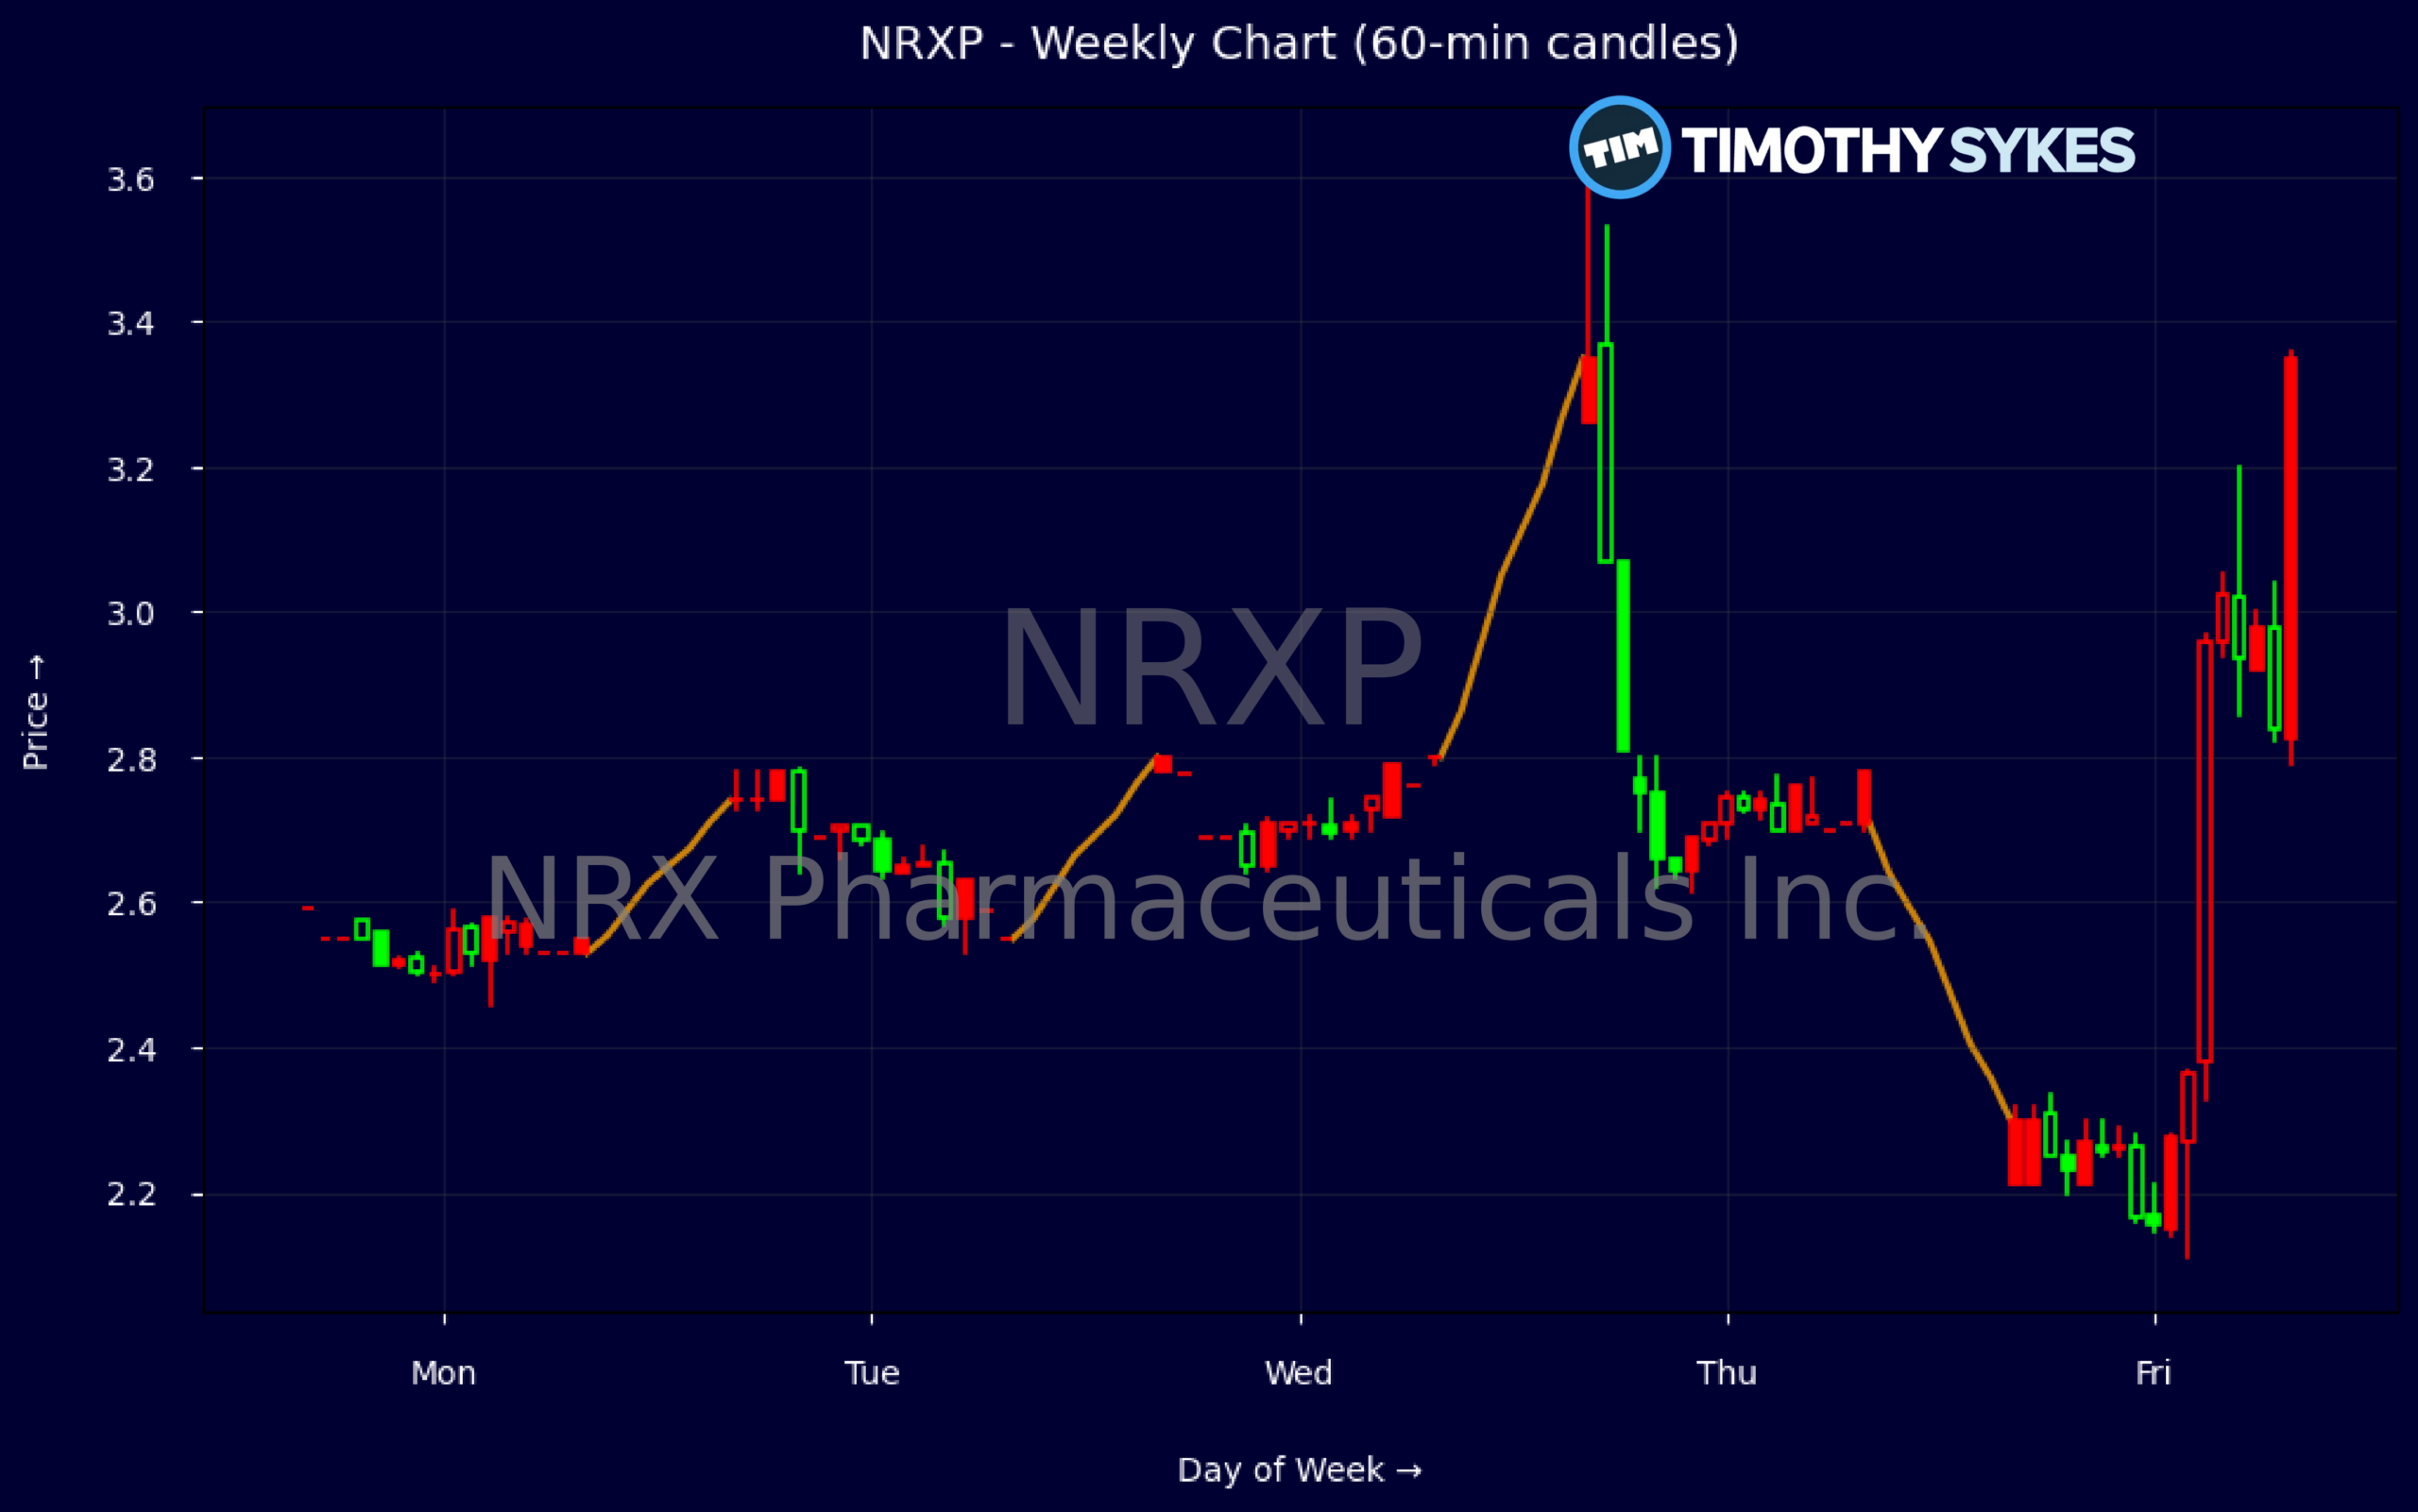
Weekly Update Oct 26 – Oct 30, 2026: On Sunday, November 01, 2026 NRX Pharmaceuticals Inc. stock [NASDAQ: NRXP] is trending down by -16.92%! Discover the key drivers behind this movement as well as our expert analysis in the detailed breakdown below.
Healthcare industry expert:
Analyst sentiment – negative
NRx Pharmaceuticals (NRXP) is an early‑stage CNS-focused biotech with negligible revenue (~$1.1M Q2 2026) and extreme negative profitability (EBIT margin ~‑697%, ROA below ‑120%), reflecting a pre-commercial R&D profile and heavy overhead. Liquidity is tight: current ratio 0.9, quick ratio 0.8, and negative equity (‑$0.17M) from large accumulated deficits, implying reliance on ongoing equity and structured financings. However, ~$26.7M cash and modest debt (~$1.2M lease/borrowings) provide a short, but real runway.
Technically, NRXP shows extreme volatility: a spike from ~$2.70 to an intraday high of $3.62 (10/29), followed by a sharp breakdown to a $2.21 close (10/30). That failed breakout and long upper wick on the weekly suggest a bull trap and emerging short-term downtrend, especially if accompanied by above-average volume on the reversal. The key actionable level is $2.20–2.25: below this, downside opens toward $1.80; above $2.75, momentum traders may re-engage.
Near-term catalysts are thin, with no meaningful recent news flow, leaving NRXP trading mainly as a speculative beta vehicle versus the Healthcare and Biotechnology & Life Sciences indices. On fundamentals and risk-adjusted basis, it screens markedly weaker than sector benchmarks, with higher dilution and balance-sheet risk. I assign a negative near-term outlook, with resistance at $2.75–3.00, support at $2.00–2.20, and a 3–6 month risk-biased trading range of $1.75–3.00, skewed to the downside.
More Breaking News
Quick Financial Overview
NRX Pharmaceuticals Inc., ticker NRXP, is printing the kind of chart and financial mix that always demands strict risk control. On the weekly data, price pushed up through $3.00 and briefly tagged the $3.60 area before fading back into the low-$2.00s. That reversal from strength to weakness, in just a few sessions, tells traders that recent buyers are now underwater and may become forced sellers on any further downside.
Intraday, the 5-minute candle shows a gap-type move from the $2.80s that was hit hard, flushing all the way down near $2.10 before bouncing slightly into the mid-$2.20s. That wide intraday range signals active day trading flow and weak hands bailing out. When a stock like NRXP loses nearly a quarter of its value in one bar, it often shifts from trend trading to pure volatility trading, where scalpers focus on quick moves rather than direction.
Fundamentally, NRXP is small, early-stage, and deeply unprofitable. Recent quarterly revenue was about $1.1M, but net loss was roughly $16.5M, leading to extreme negative margins and a return on assets worse than -100%. The balance sheet shows around $26.7M in cash but negative equity of about -$0.2M, plus a current ratio just under 1.0, signaling tight liquidity over the next year. Enterprise value near $111.4M and a price-to-sales ratio above 30 reinforce that traders are paying a premium relative to current sales while the business continues to burn cash.
Conclusion
This is stock news, not investment advice. Timothy Sykes News delivers real-time stock market news focused on key catalysts driving short-term price movements. Our content is tailored for active traders and investors seeking to capitalize on rapid price fluctuations, particularly in volatile sectors like penny stocks. Readers come to us for detailed coverage on earnings reports, mergers, FDA approvals, new contracts, and unusual trading volumes that can trigger significant short-term price action. Some users utilize our news to explain sudden stock movements, while others rely on it for diligent research into potential investment opportunities.
Dive deeper into the world of trading with Timothy Sykes, renowned for his expertise in penny stocks. Explore his top picks and discover the strategies that have propelled him to success with these articles:
- Penny Stocks Trading Guide
- Best Penny Stocks Under $1 to Buy Today
- Top 8 Penny Stocks to Watch on Robinhood
Once you’ve got some stocks on watch, elevate your trading game with StocksToTrade the ultimate platform for traders. With specialized tools for swing and day trading, StocksToTrade will guide you through the market’s twists and turns.
Dig into StocksToTrade’s watchlists here:





Leave a reply