
Csquare Inc. stocks have been trading down by -11.1 percent following reports of a major regulatory probe into its practices.
Market Insights For Active Traders
- Weekly candles show Csquare Inc. dropping from a recent high above $15 to around $13, signaling a short-term downtrend.
- Intraday action printed a wide 5-minute range from roughly $12.30 to $15.11, showing aggressive two-way trading.
- Revenue near $987M with negative pretax margins and returns keeps CSQR in a turnaround zone, not a stable compounder.
- Heavy capital spending and negative free cash flow highlight balance-sheet pressure that traders should not ignore.
- Price-to-sales above 5 suggests Csquare Inc. is still priced for growth despite ongoing losses.
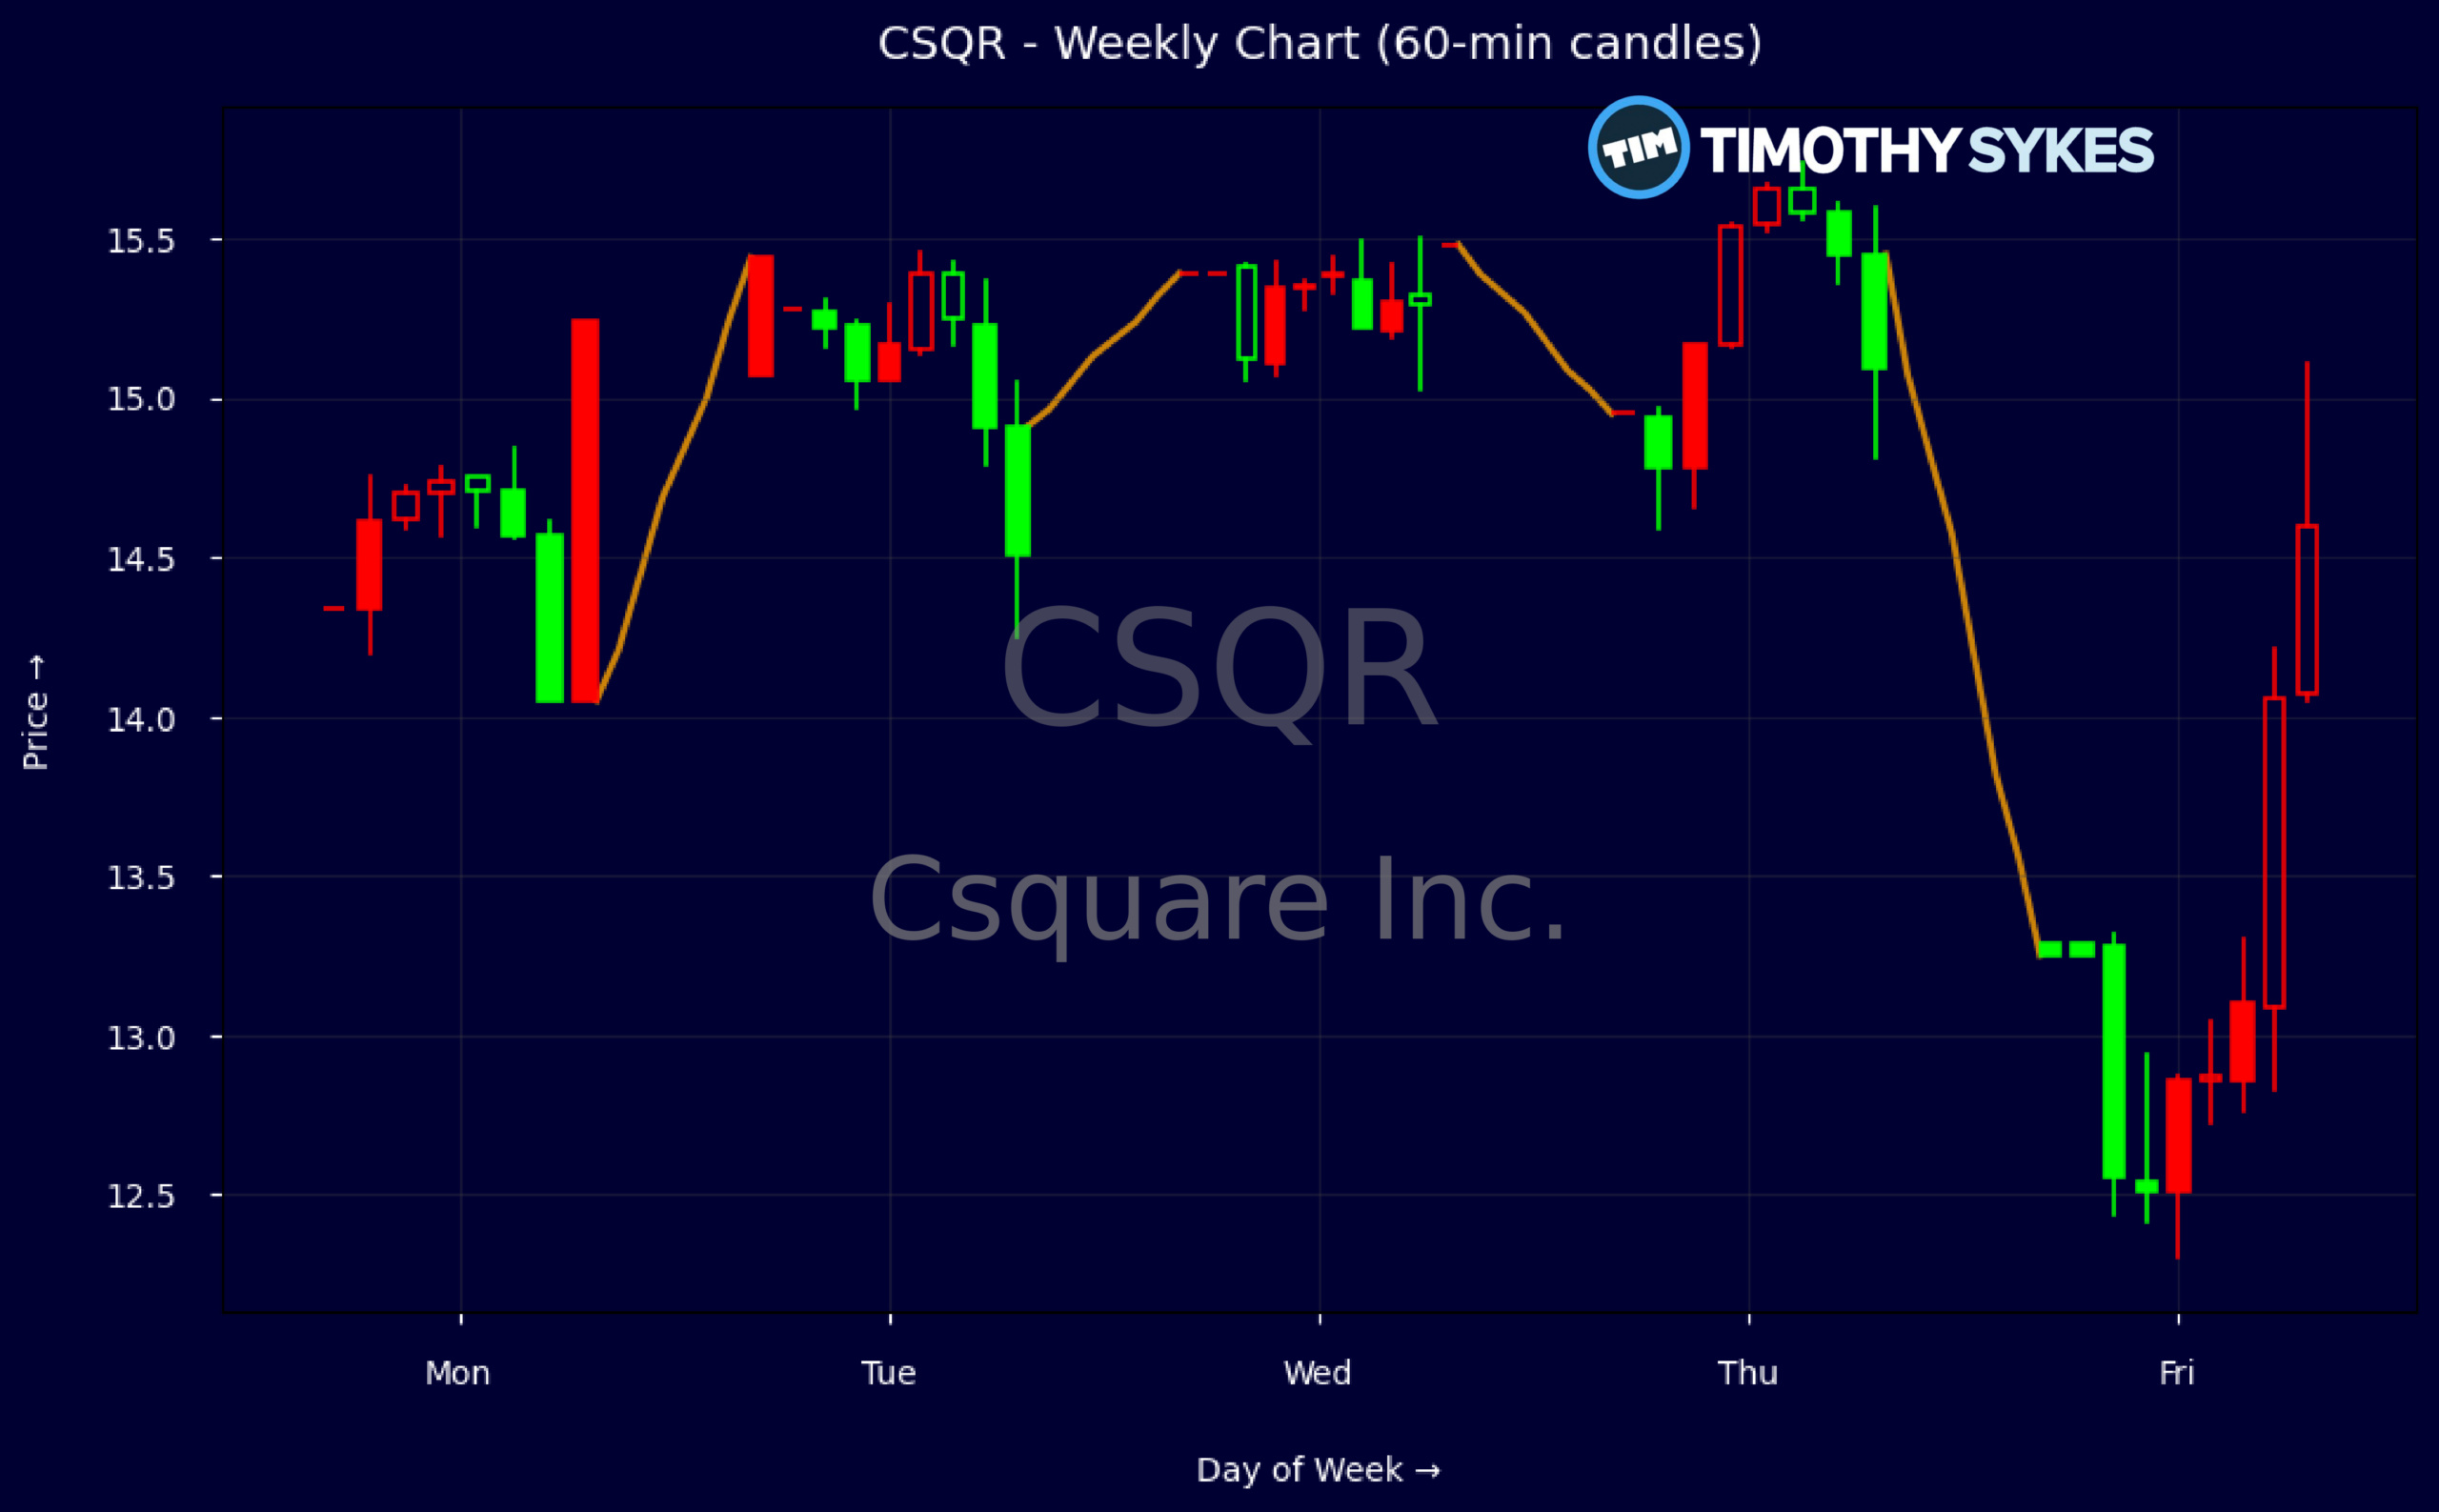
Weekly Update Oct 26 – Oct 30, 2026: On Sunday, November 01, 2026 Csquare Inc. stock [NYSE: CSQR] is trending down by -11.1%! Discover the key drivers behind this movement as well as our expert analysis in the detailed breakdown below.
Technology industry expert:
Analyst sentiment – negative
CSQR sits in a weak fundamental position despite solid top-line scale. Trailing revenue of ~$987m against an enterprise value of ~$7.8bn implies a rich ~5.3x EV/sales for a business with a -24.9% pretax margin and negative ROA of -2.5%. Equity is deeply negative (BVPS -2.33, equity -$389m) with heavy leverage (long-term debt ~$5.0bn, capital leases ~$0.7bn). Q2’26 free cash flow was sharply negative (-$90m) on capex intensity, making the dividend outlay (~$131m) economically unsustainable.
Technically, the stock has rolled over sharply, with a failed push above $15.40 followed by an aggressive break to $13.25–13.30, establishing a clear short-term downtrend. The 5-minute tape (not shown here) corroborates persistent selling pressure, with weak bounces and expanding downside ranges on elevated volume into the close. $15.40 now marks a decisive resistance pivot; tactically, I would favor selling strength into the $14.90–15.40 zone with a downside trading target near $12.50, using $15.75 as a tight risk cap.
With no identifiable positive news catalysts and deteriorating economics, CSQR screens poorly versus broader Technology and Software & IT Services benchmarks that typically deliver positive ROE, cleaner balance sheets, and free-cash-flow-backed multiples. Near-term, I expect the shares to underperform peers as investors reassess leverage, negative FCF, and accounting equity deficits. I see resistance at $15.40, initial support at $13.00, and a 3–6 month downside-biased trading range of $11–14, barring an unforeseen strategic event.
More Breaking News
Quick Financial Overview
Csquare Inc. and ticker CSQR sit in a tricky spot where the chart and financials do not fully align. The stock has traded in the mid-teens, with weekly data showing a move from about $15.44 down toward $13.29. That slide points to fading momentum after a brief push higher, the kind of action that often shifts a name from breakout candidate into pullback territory.
On the intraday tape, CSQR showed a wide 5-minute bar, with price swinging between roughly $12.30 and $15.11 before closing around $13.29. That kind of range in a single candle tells traders there is real friction between buyers and sellers. Bulls managed to push CSQR above $15 during the session, but sellers hit back hard, driving it down more than $2 from the high by the close.
Under the hood, Csquare Inc. produced about $280.4M in quarterly revenue and roughly $987M on a trailing basis, yet still posted a net loss of around $48.8M for the latest quarter. Pretax profit margin sits near -24.9%, and return on assets is about -2.49%, showing the core business is not yet earning its cost of capital. With an enterprise value near $7.78B and a price-to-sales ratio around 5.29, traders are paying a growth multiple for a company that is still burning cash, as shown by roughly -$90.1M in free cash flow.
Conclusion
This is stock news, not investment advice. Timothy Sykes News delivers real-time stock market news focused on key catalysts driving short-term price movements. Our content is tailored for active traders and investors seeking to capitalize on rapid price fluctuations, particularly in volatile sectors like penny stocks. Readers come to us for detailed coverage on earnings reports, mergers, FDA approvals, new contracts, and unusual trading volumes that can trigger significant short-term price action. Some users utilize our news to explain sudden stock movements, while others rely on it for diligent research into potential investment opportunities.
Dive deeper into the world of trading with Timothy Sykes, renowned for his expertise in penny stocks. Explore his top picks and discover the strategies that have propelled him to success with these articles:
- Penny Stocks Trading Guide
- Best Penny Stocks Under $1 to Buy Today
- Top 8 Penny Stocks to Watch on Robinhood
Once you’ve got some stocks on watch, elevate your trading game with StocksToTrade the ultimate platform for traders. With specialized tools for swing and day trading, StocksToTrade will guide you through the market’s twists and turns.
Dig into StocksToTrade’s watchlists here:





Leave a reply