
Leverage Shares 2X Long CBRS Daily ETF stocks have been trading down by -4.81 percent amid sharply negative sector sentiment
Key Takeaways
- Leverage Shares 2X Long CBRS Daily ETF (CBRG) has dropped roughly two-thirds from late-September highs, showing sustained selling pressure.
- Recent intraday CBRG trading shows a grind lower from the premarket spike, signaling control by sellers most of the day.
- The leveraged structure of CBRG is amplifying downside in the underlying name, turning small moves into sharp declines.
- Liquidity appears adequate intraday, but wide swings demand tight risk controls for active CBRG traders.
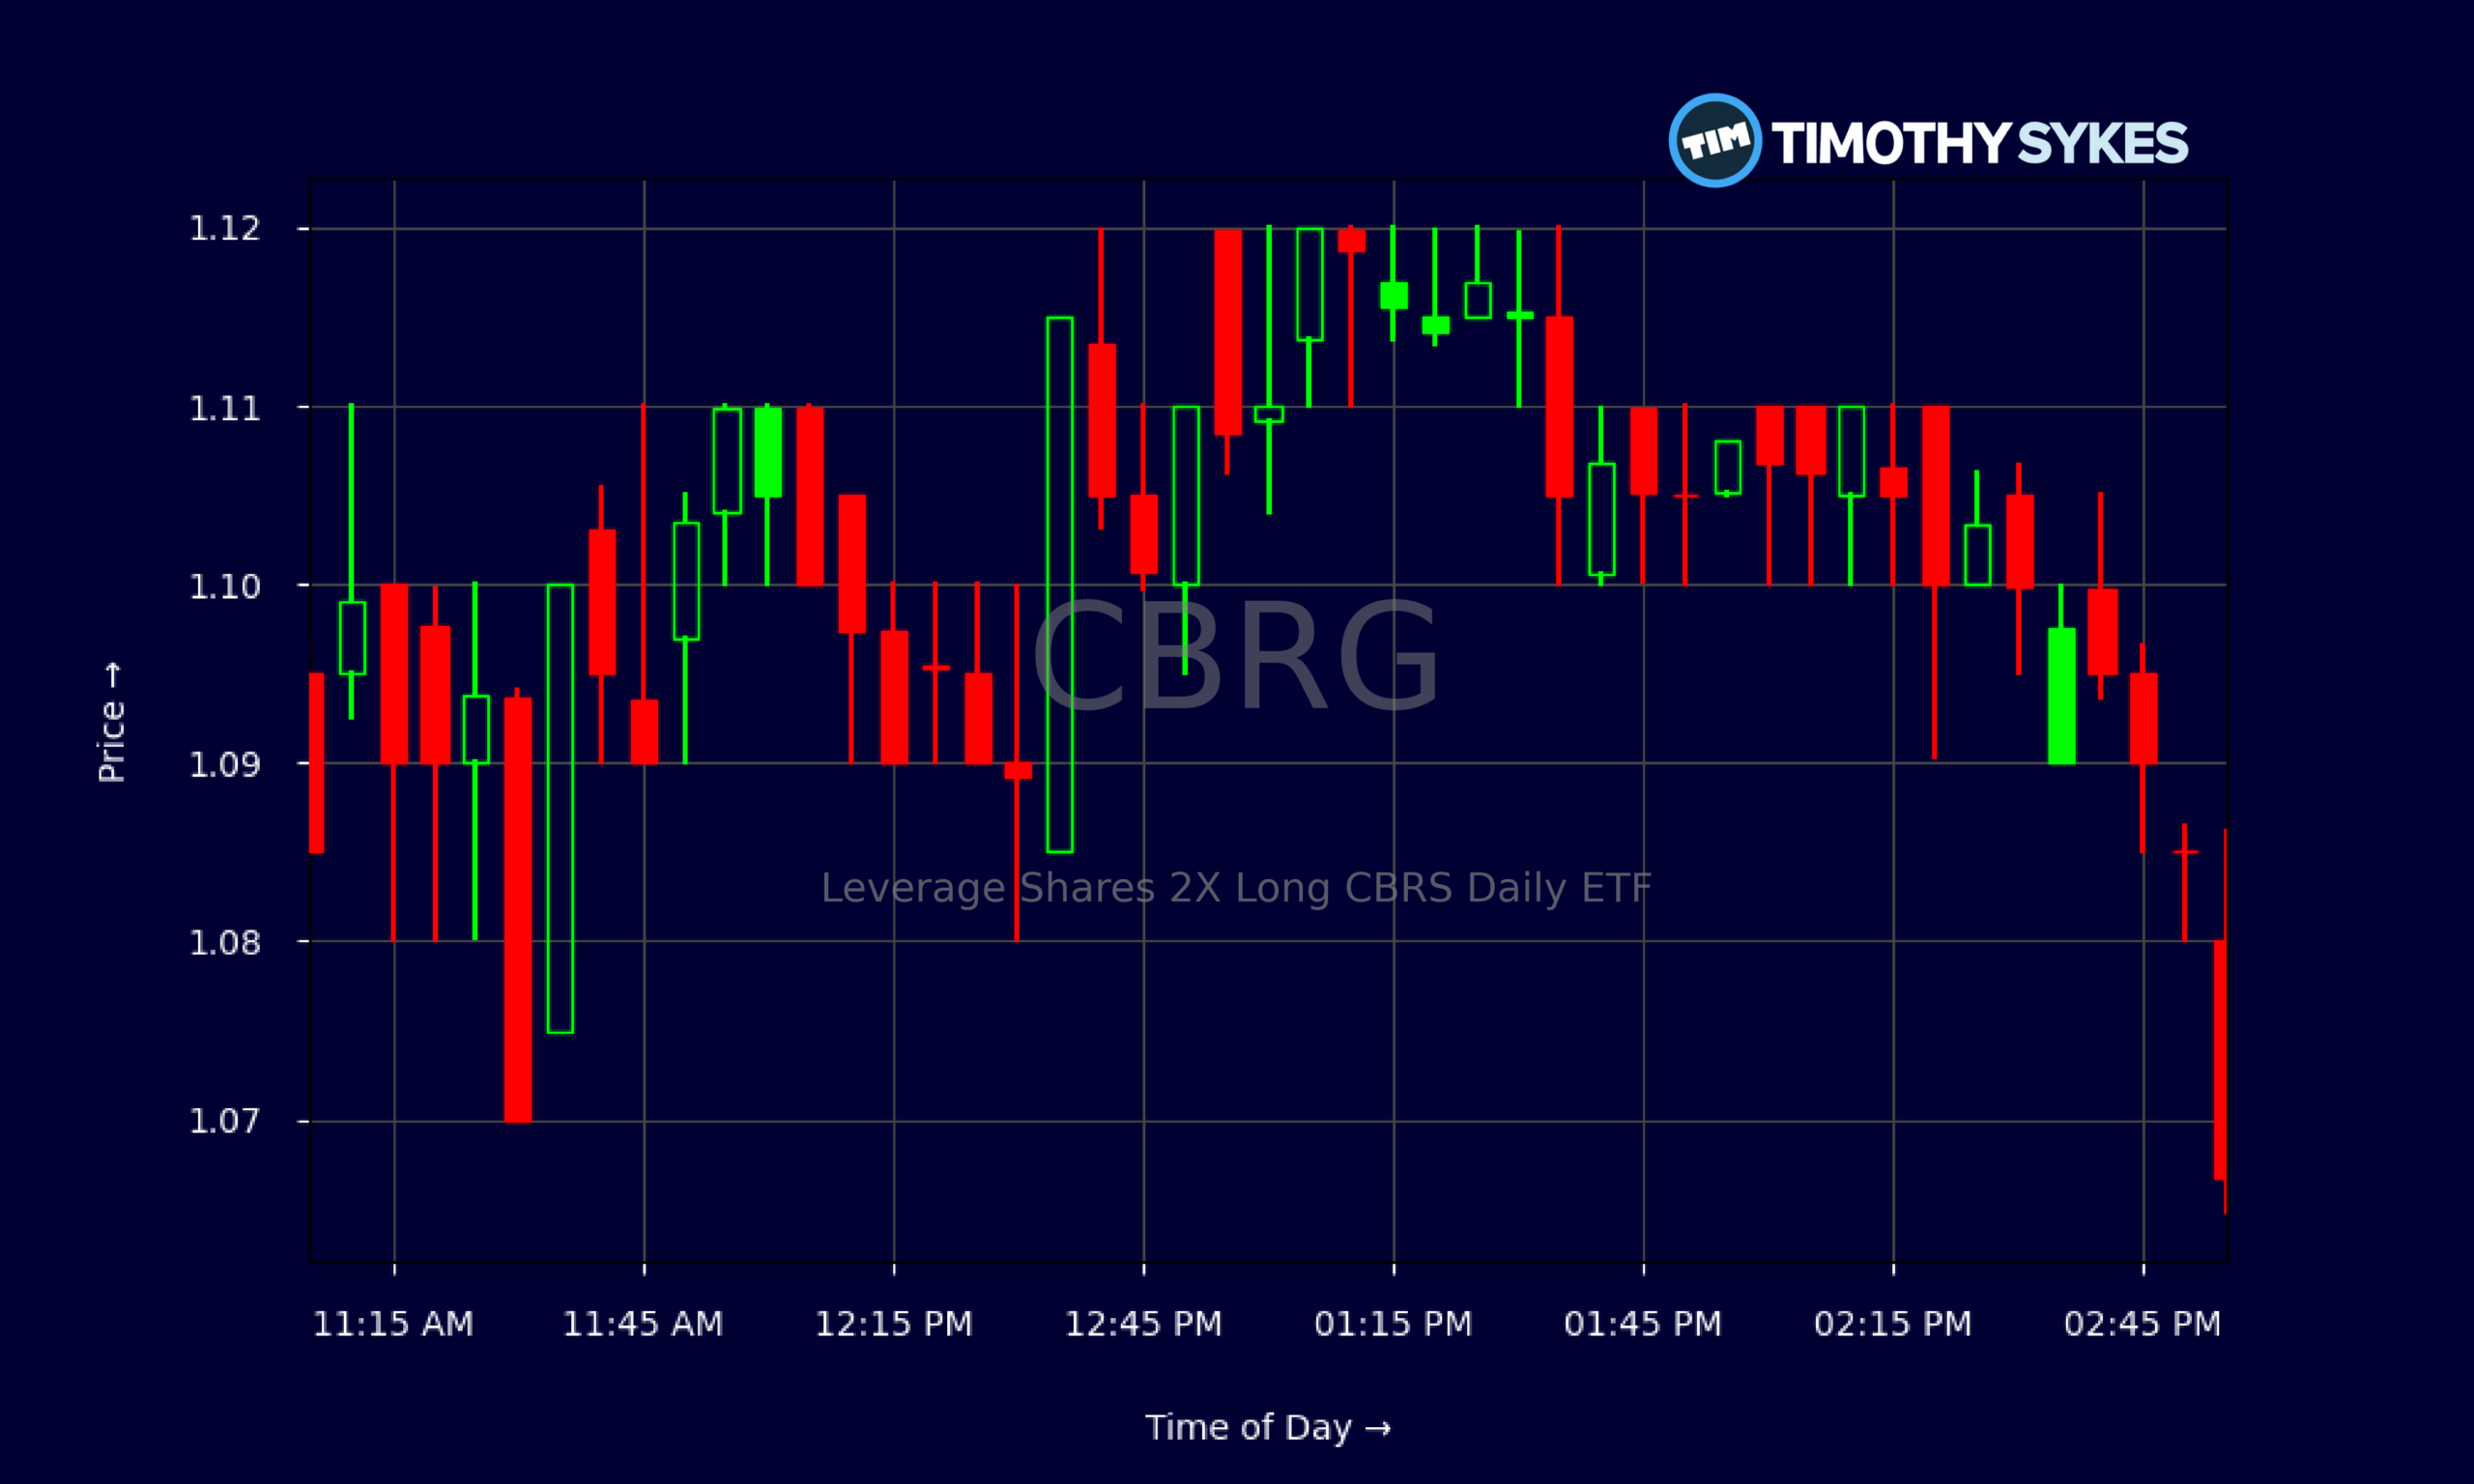
Live Update At 15:05:30 EDT: On Wednesday, October 21, 2026 Leverage Shares 2X Long CBRS Daily ETF stock [BATS Global Markets: CBRG] is trending down by -4.81%! Discover the key drivers behind this movement as well as our expert analysis in the detailed breakdown below.
Quick Financial Overview
Leverage Shares 2X Long CBRS Daily ETF is a pure trading vehicle. CBRG is designed to deliver roughly twice the daily move of its underlying stock, so it naturally behaves like a rollercoaster. When the base name trends cleanly, CBRG can move fast in the same direction. When the tape chops, this ETF often bleeds.
The daily chart shows exactly that decay. CBRG closed near $3.32 on 2026/09/28 and $3.28 on 2026/09/29. From there, the slide began. By 2026/10/21, CBRG finished around $1.07, less than half of where it traded just over three weeks earlier. That’s the double-edged sword of leverage: what turbocharges gains also accelerates losses.
More Breaking News
Traditional fundamentals and key ratios for CBRG are basically placeholders, which fits its role. This is not a cash-flow story; it is a derivative of price action. For traders, the real “financials” are volatility, range, and liquidity. On that front, CBRG still offers enough volume and intraday range to matter, but only for those who respect how quickly these 2X products move against them.
Why Traders Are Watching CBRG’s Breakdown
The story on the CBRG daily chart is momentum in reverse. Leverage Shares 2X Long CBRS Daily ETF traded above $3.50 in late September, then slipped under $3 by 2026/09/30. Early October still showed life, with CBRG printing closes between $2.35 and $2.76 on 2026/10/01–02 and even pushing to $2.64–$2.76 across 2026/10/05–06. That was the last real attempt to hold the uptrend.
From there, lower highs took over. CBRG topped intraday at $2.86 on 2026/10/06, $2.585 on 2026/10/07, and $2.4999 on 2026/10/08. Each bounce failed a bit lower. That’s classic distribution in a leveraged product. By 2026/10/12–13, CBRG was closing in the $1.77–$1.82 range. Sellers had clearly flipped the script.
Mid-October brought more pressure. CBRG slipped from $1.655 on 2026/10/15 to $1.305 on 2026/10/16, then to $1.16–$1.12 across 2026/10/19–20. The latest close around $1.07 on 2026/10/21 confirms a full trend breakdown, with the ETF losing nearly two-thirds of its value from the late-September peak.
Intraday action on 2026/10/21 backs this up. CBRG opened near $1.16, spiked toward $1.18 in premarket, then trended down most of the regular session. There was some chop between $1.09 and $1.12 midday, but by the final hour CBRG hovered just above the lows. For short-term traders, that intraday lower-high structure leaves CBRG solidly in “fade the pops” territory until a real base forms.
Conclusion
For active traders, CBRG is a live case study in what leveraged ETFs really do. Leverage Shares 2X Long CBRS Daily ETF has taken the underlying stock’s weakness and magnified it into a steep, persistent downtrend. From above $3 in late September to nearly $1 on 2026/10/21, every failed bounce on the chart shows why treating CBRG like a swing “hold and hope” is dangerous.
Right now, the chart says caution. CBRG is in a clear downtrend, with lower highs on both the daily and intraday time frames. Until Leverage Shares 2X Long CBRS Daily ETF can reclaim and hold prior resistance levels — first around $1.20, then the $1.50s, and eventually the $2 area — the path of least resistance remains down. That does not mean there won’t be sharp bounces; with a 2X product like CBRG, those bounces can be violent. But for disciplined traders, those are short-lived trading opportunities, not signals to ignore risk.
The edge comes from treating CBRG as a tool, not a lottery ticket. Size small, cut losses quickly, and let the chart, not emotions, call the shots. As Tim Sykes likes to say, “The market doesn’t owe you anything — your only job is to protect your account so you’re still around for the next great trade.” As millionaire penny stock trader and teacher Tim Sykes, says, “You must adapt to the market; the market will not adapt to you.”.
This is stock news, not investment advice. Timothy Sykes News delivers real-time stock market news focused on key catalysts driving short-term price movements. Our content is tailored for active traders and investors seeking to capitalize on rapid price fluctuations, particularly in volatile sectors like penny stocks. Readers come to us for detailed coverage on earnings reports, mergers, FDA approvals, new contracts, and unusual trading volumes that can trigger significant short-term price action. Some users utilize our news to explain sudden stock movements, while others rely on it for diligent research into potential investment opportunities.
Dive deeper into the world of trading with Timothy Sykes, renowned for his expertise in penny stocks. Explore his top picks and discover the strategies that have propelled him to success with these articles:
- Penny Stocks Trading Guide
- Best Penny Stocks Under $1 to Buy Today
- Top 8 Penny Stocks to Watch on Robinhood
Once you’ve got some stocks on watch, elevate your trading game with StocksToTrade the ultimate platform for traders. With specialized tools for swing and day trading, StocksToTrade will guide you through the market’s twists and turns.
Dig into StocksToTrade’s watchlists here:





Leave a reply