
JBDI Holdings Limited stocks have been trading up by 10.68 percent following optimistic sentiment from the latest Ma-related developments.
Market Insights For Active Traders
- Recent weekly action shows JBDI sliding from near $3.00 toward the mid-$2s, signaling a cooling phase after a sharp push higher.
- Intraday range between roughly $2.30 and $3.95 shows heavy volatility that can reward disciplined traders but punish late chasers.
- Price near 2.5–2.6 sits at a key short‑term decision zone where buyers and sellers have recently battled.
- Balance sheet carries more equity than liabilities, giving JBDI Holdings Limited some cushion despite operating uncertainties.
- Modest revenue base and thin margins make JBDI a higher‑risk, shorter‑term trading vehicle rather than a stable compounder.
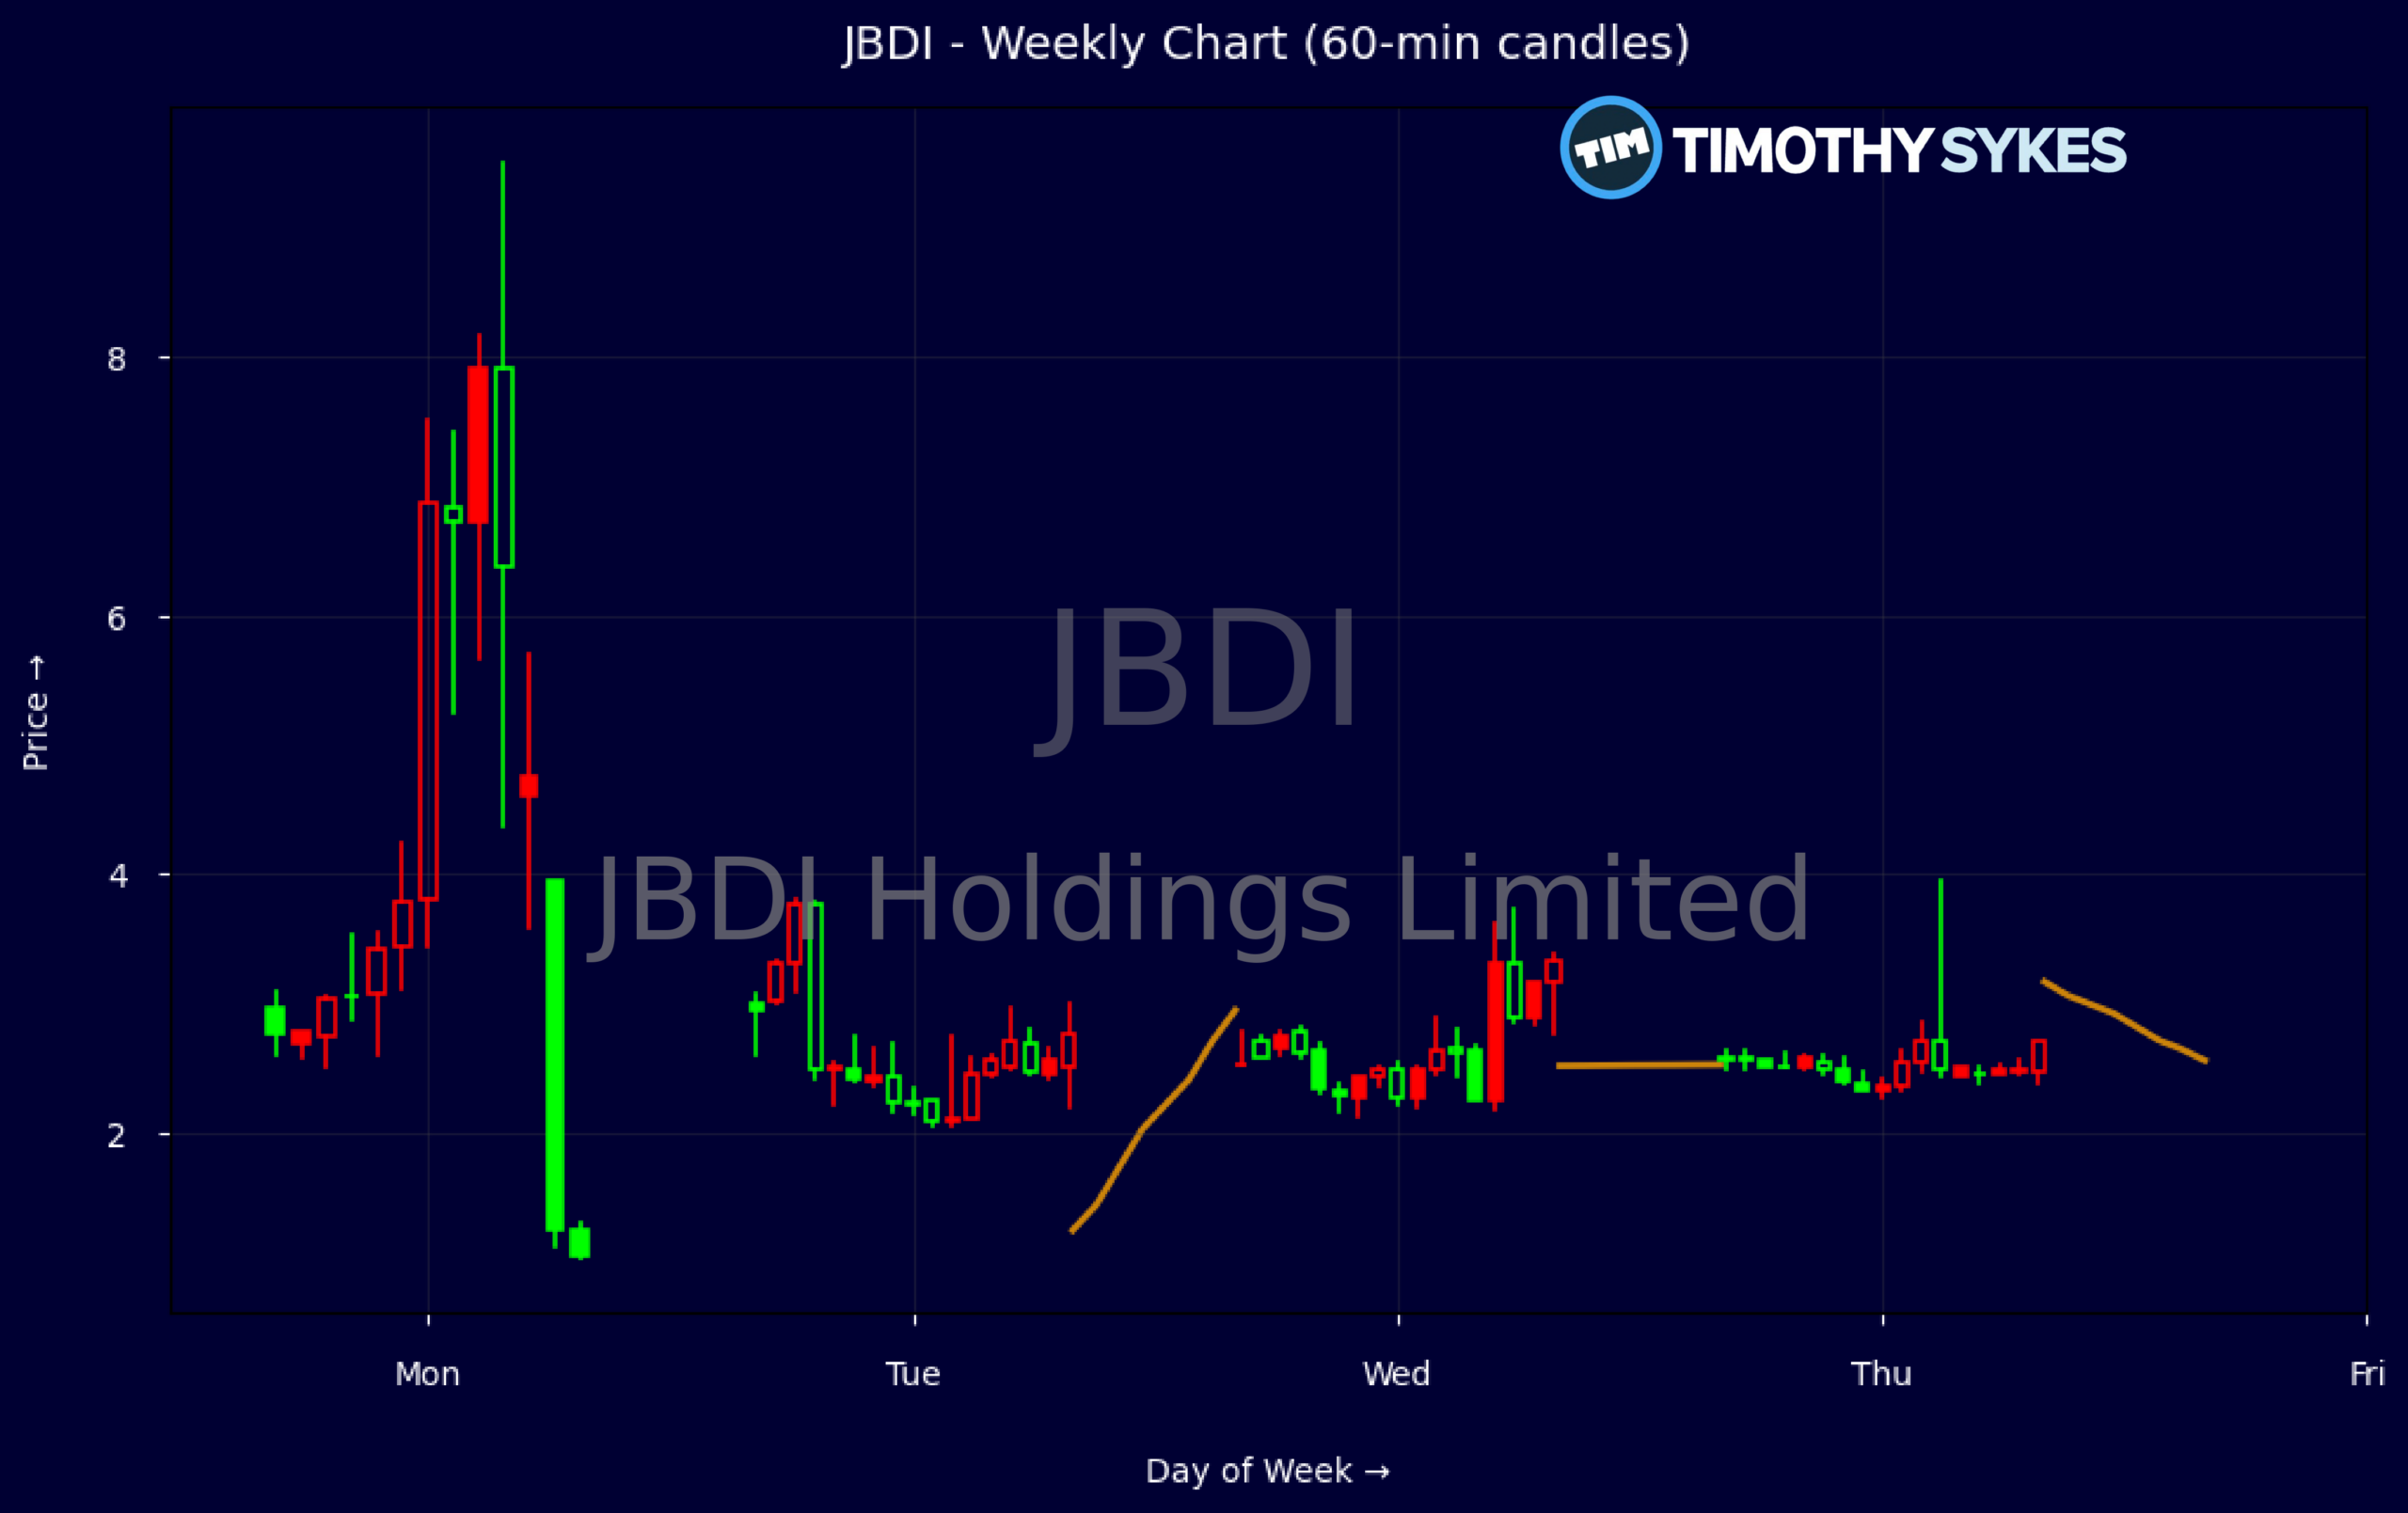
Weekly Update Oct 12 – Oct 16, 2026: On Saturday, October 17, 2026 JBDI Holdings Limited stock [NASDAQ: JBDI] is trending up by 10.68%! Discover the key drivers behind this movement as well as our expert analysis in the detailed breakdown below.
Consumer Discretionary industry expert:
Analyst sentiment – neutral
JBDI operates as a small-cap player in Consumer Discretionary, likely in niche packaging or related services, with revenue of roughly $8.5 million and enterprise value near $23.8 million, implying a modest 1.12x price-to-sales but a richer 2.48x price-to-book. The balance sheet is solid: equity of $3.84 million, leverage ratio of 1.6, and long-term debt/capital of only 0.21. However, negative retained earnings and thin ROIC of 2.9% highlight still-fragile profitability and limited reinvestment capacity.
Technically, JBDI has been oscillating in a tight $2.50–$3.10 band, with recent weekly closes slipping from $3.00 to $2.59, signaling a mild short-term downtrend within a broader sideways structure. Intraday 5-minute action shows fading momentum on upticks and heavier volume near $2.55–$2.60, confirming that zone as immediate support. A clear, high-volume break above $3.10 would be a buy trigger, while a stop should sit just under $2.50 to manage downside risk tightly.
With no identifiable news, the stock trades as a pure microcap value and sentiment play versus generally stronger, scale-driven Consumer Discretionary and Containers & Packaging peers. Sector leaders show higher margins and ROIC, so JBDI must improve profitability to close its valuation gap. Near term, $2.50 is firm support and $3.25–$3.40 is resistance. Base case 6–12 month fair value sits around $3.10, implying selective, risk-aware accumulation only near the lower end of the range.
More Breaking News
Quick Financial Overview
JBDI Holdings Limited runs a relatively small operation, with revenue of about $8.52M and revenue per share under $1. That tells traders this is a lower‑cap, more speculative name where price can move fast on relatively modest order flow. A price‑to‑sales ratio around 1.12 keeps the valuation grounded versus revenue, but the price‑to‑book near 2.48 shows traders are already paying a premium over the $0.40 book value per share.
The latest balance sheet snapshot shows total assets near $6.29M against total liabilities of about $2.45M, leaving equity around $3.84M. Cash of roughly $1.96M and working capital close to $3.40M suggest JBDI is not under immediate balance‑sheet stress. However, negative retained earnings near -$3.51M underline a history of losses, so any growth story still needs to prove itself through consistent profitability.
Return on capital at about 2.91% over the last year is modest and not yet pointing to a high‑efficiency operator. A leverage ratio of 1.6 and long‑term lease obligations over $1.0M mean fixed costs remain meaningful. For traders, that backdrop supports a “show me” stance: the financials are stable enough to support ongoing operations, but not strong enough to remove downside risk if sentiment turns.
Conclusion
This is stock news, not investment advice. Timothy Sykes News delivers real-time stock market news focused on key catalysts driving short-term price movements. Our content is tailored for active traders and investors seeking to capitalize on rapid price fluctuations, particularly in volatile sectors like penny stocks. Readers come to us for detailed coverage on earnings reports, mergers, FDA approvals, new contracts, and unusual trading volumes that can trigger significant short-term price action. Some users utilize our news to explain sudden stock movements, while others rely on it for diligent research into potential investment opportunities.
Dive deeper into the world of trading with Timothy Sykes, renowned for his expertise in penny stocks. Explore his top picks and discover the strategies that have propelled him to success with these articles:
- Penny Stocks Trading Guide
- Best Penny Stocks Under $1 to Buy Today
- Top 8 Penny Stocks to Watch on Robinhood
Once you’ve got some stocks on watch, elevate your trading game with StocksToTrade the ultimate platform for traders. With specialized tools for swing and day trading, StocksToTrade will guide you through the market’s twists and turns.
Dig into StocksToTrade’s watchlists here:





Leave a reply