

OmniAb Inc. stocks have been trading down by -8.01 percent after investors reacted negatively to its latest clinical trial setback.
What Traders Need To Know
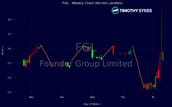
- Price has been stuck between roughly $4.30 and $5.10, with recent weekly closes near the upper end of that band.
- Intraday action shows a sharp fade from $4.78 to about $4.33, highlighting supply overhead and weak follow-through.
- OmniAb Inc. continues to post heavy operating losses despite very high gross margins.
- A strong liquidity profile and low debt give OABI time, but not a free pass, to keep burning cash.
- Short-term traders are watching whether $4.30 support or the $5.00 area breaks first for the next real move.

Weekly Update Aug 31 – Sep 04, 2026: On Saturday, September 05, 2026 OmniAb Inc. stock [NASDAQ: OABI] is trending down by -8.01%! Discover the key drivers behind this movement as well as our expert analysis in the detailed breakdown below.
Healthcare industry expert:
Analyst sentiment – negative
OABI operates as an early‑stage, high‑gross‑margin biotech with severely negative operating leverage. Reported 99.9% gross margin on $18.7M revenue underscores a royalty/service-heavy mix, but EBIT margin of -120% and profit margin of -115% highlight an unsustainable cost base. ROE of about -17% and ROA around -15% confirm value destruction. Yet liquidity is strong (current ratio 4.8, quick ratio 4.5) with minimal leverage (debt/equity 0.07), giving multi‑year runway despite weak 3‑year revenue CAGR (-16.5%).
Technically, OABI shows short-term mean-reversion within a developing trading range. The weekly tape from 4.27–5.08 reflects failed upside momentum after the 5.08 spike (likely volume-driven event) and quick retracement toward the low 4s, signaling supply above $5 and short-term distribution. Intraday 5‑minute candles show fading follow‑through above 4.80. Dominant trend is sideways-to-weak. A clear actionable level is $4.20–4.25 as tactical support; a decisive break below invites momentum shorts toward $3.80.
With no fresh fundamental catalysts disclosed, OABI trades as a small-cap biotech sentiment vehicle, lagging broader Healthcare and Biotechnology & Life Sciences benchmarks that now reward visible revenue growth and cleaner paths to profitability. Relative to peers, OABI’s valuation at ~18x sales and >60x cash flow is stretched given shrinking revenue. Base case is range-bound trading with resistance at $5.00–5.10 and support near $4.20. Risk‑reward skews negative absent pipeline or partnership upside surprises.
More Breaking News
Quick Financial Overview
OmniAb Inc. (OABI) is trading in a tight band, with weekly data showing opens in the mid-$4 range and recent closes edging slightly higher toward $4.50–$4.80. A spike to $5.08 that failed to hold and pulled back toward $4.37 tells traders supply is waiting above $5.00. For short-term setups, that failed breakout matters more than the small week-to-week closes, because it highlights where aggressive sellers are currently positioned.
On the intraday side, a single 5-minute bar dropping from $4.78 to $4.33 is a clear sign of how quickly liquidity can disappear in OABI. That kind of wide candle, with no bounce in the data, warns day traders that slippage and air pockets are real risks when momentum flips. For scalpers and tight-risk traders, this underlines the need for hard stops and position sizing that assumes sudden $0.30–$0.50 swings.
Fundamentally, OmniAb Inc. shows classic early-stage biotech-like economics: tiny revenue, big losses, and a solid balance sheet. Revenue in the last period was about $18.7M, but EBIT margin sits near -120% and net margins are roughly -115%, so the business is far from break-even. Yet gross margin is about 99.9%, and financial strength metrics are strong: current ratio around 4.8, quick ratio 4.5, and total debt to equity just 0.07, with working capital in the $52.3M area. Enterprise value is roughly $596.5M, price-to-sales is high at about 18, and price-to-free-cash near 67, which means traders are paying up for future potential despite negative returns on equity and assets.
Conclusion
OmniAb Inc. currently sits at an interesting balance point for traders: price is relatively stable in the mid-$4 range, but the underlying business is deeply unprofitable. The weekly chart for OABI shows a contained range with failed extension above $5.00, suggesting clear levels to frame trades. Support around $4.30 and resistance near $5.00–$5.10 give swing traders a defined battlefield, with that sharp intraday drop from $4.78 to $4.33 reminding everyone how quickly bids can vanish.
From a financial view, OABI’s negative EBIT, EBITDA, and returns on capital highlight substantial ongoing cash burn, even though recent free cash flow was positive at roughly $2.6M in the last reported quarter. High gross margins and a strong liquidity profile offer runway, but the rich valuation multiples mean the market already prices in a meaningful improvement in the story. For traders, that sets up an asymmetric backdrop: upside likely needs clear progress toward operating leverage, while downside risk can accelerate if the market grows tired of funding losses.
For educational and research purposes, the key is to let the levels and the numbers guide your plan rather than any story you want to believe. As millionaire penny stock trader and teacher Tim Sykes says, “It’s better to go home at zero than to go home in the red.”. That mindset applies here: risk management and disciplined exits matter more than forcing a trade just because the chart looks interesting. As I tell my students, “Price action gives you the timing, but the financials tell you how hard you can press the trade.””,”scores”:{“risk-level”:”medium”},”trade”:”true
This is stock news, not investment advice. Timothy Sykes News delivers real-time stock market news focused on key catalysts driving short-term price movements. Our content is tailored for active traders and investors seeking to capitalize on rapid price fluctuations, particularly in volatile sectors like penny stocks. Readers come to us for detailed coverage on earnings reports, mergers, FDA approvals, new contracts, and unusual trading volumes that can trigger significant short-term price action. Some users utilize our news to explain sudden stock movements, while others rely on it for diligent research into potential investment opportunities.
Dive deeper into the world of trading with Timothy Sykes, renowned for his expertise in penny stocks. Explore his top picks and discover the strategies that have propelled him to success with these articles:
- Penny Stocks Trading Guide
- Best Penny Stocks Under $1 to Buy Today
- Top 8 Penny Stocks to Watch on Robinhood
Once you’ve got some stocks on watch, elevate your trading game with StocksToTrade the ultimate platform for traders. With specialized tools for swing and day trading, StocksToTrade will guide you through the market’s twists and turns.
Dig into StocksToTrade’s watchlists here:




Leave a reply