

Nebius Group N.V. stocks have been trading up by 3.25 percent after strong AI cloud demand boosted investor optimism.
Key Takeaways
- Rapidly scaling AI cloud player Nebius Group NBIS reports 454% year‑over‑year revenue growth and multi‑billion dollars in deferred revenue, signaling strong demand visibility.
- Long‑term 50‑MW capacity deal at AIB’s southeastern U.S. data center gives Nebius Group dedicated AI infrastructure under a 12‑year agreement.
- Shares of Nebius Group NBIS ticked up 1.2% after acquiring Inferize, an AI infrastructure startup focused on faster large‑model deployment.
- NBIS has logged multiple 2%+ premarket pops, becoming a favored Wallstreetbets trading vehicle with strong meme‑style momentum.
- A 2.8% premarket rebound after a 7.4% prior‑session drop in Nebius Group NBIS underscores sentiment‑driven volatility.
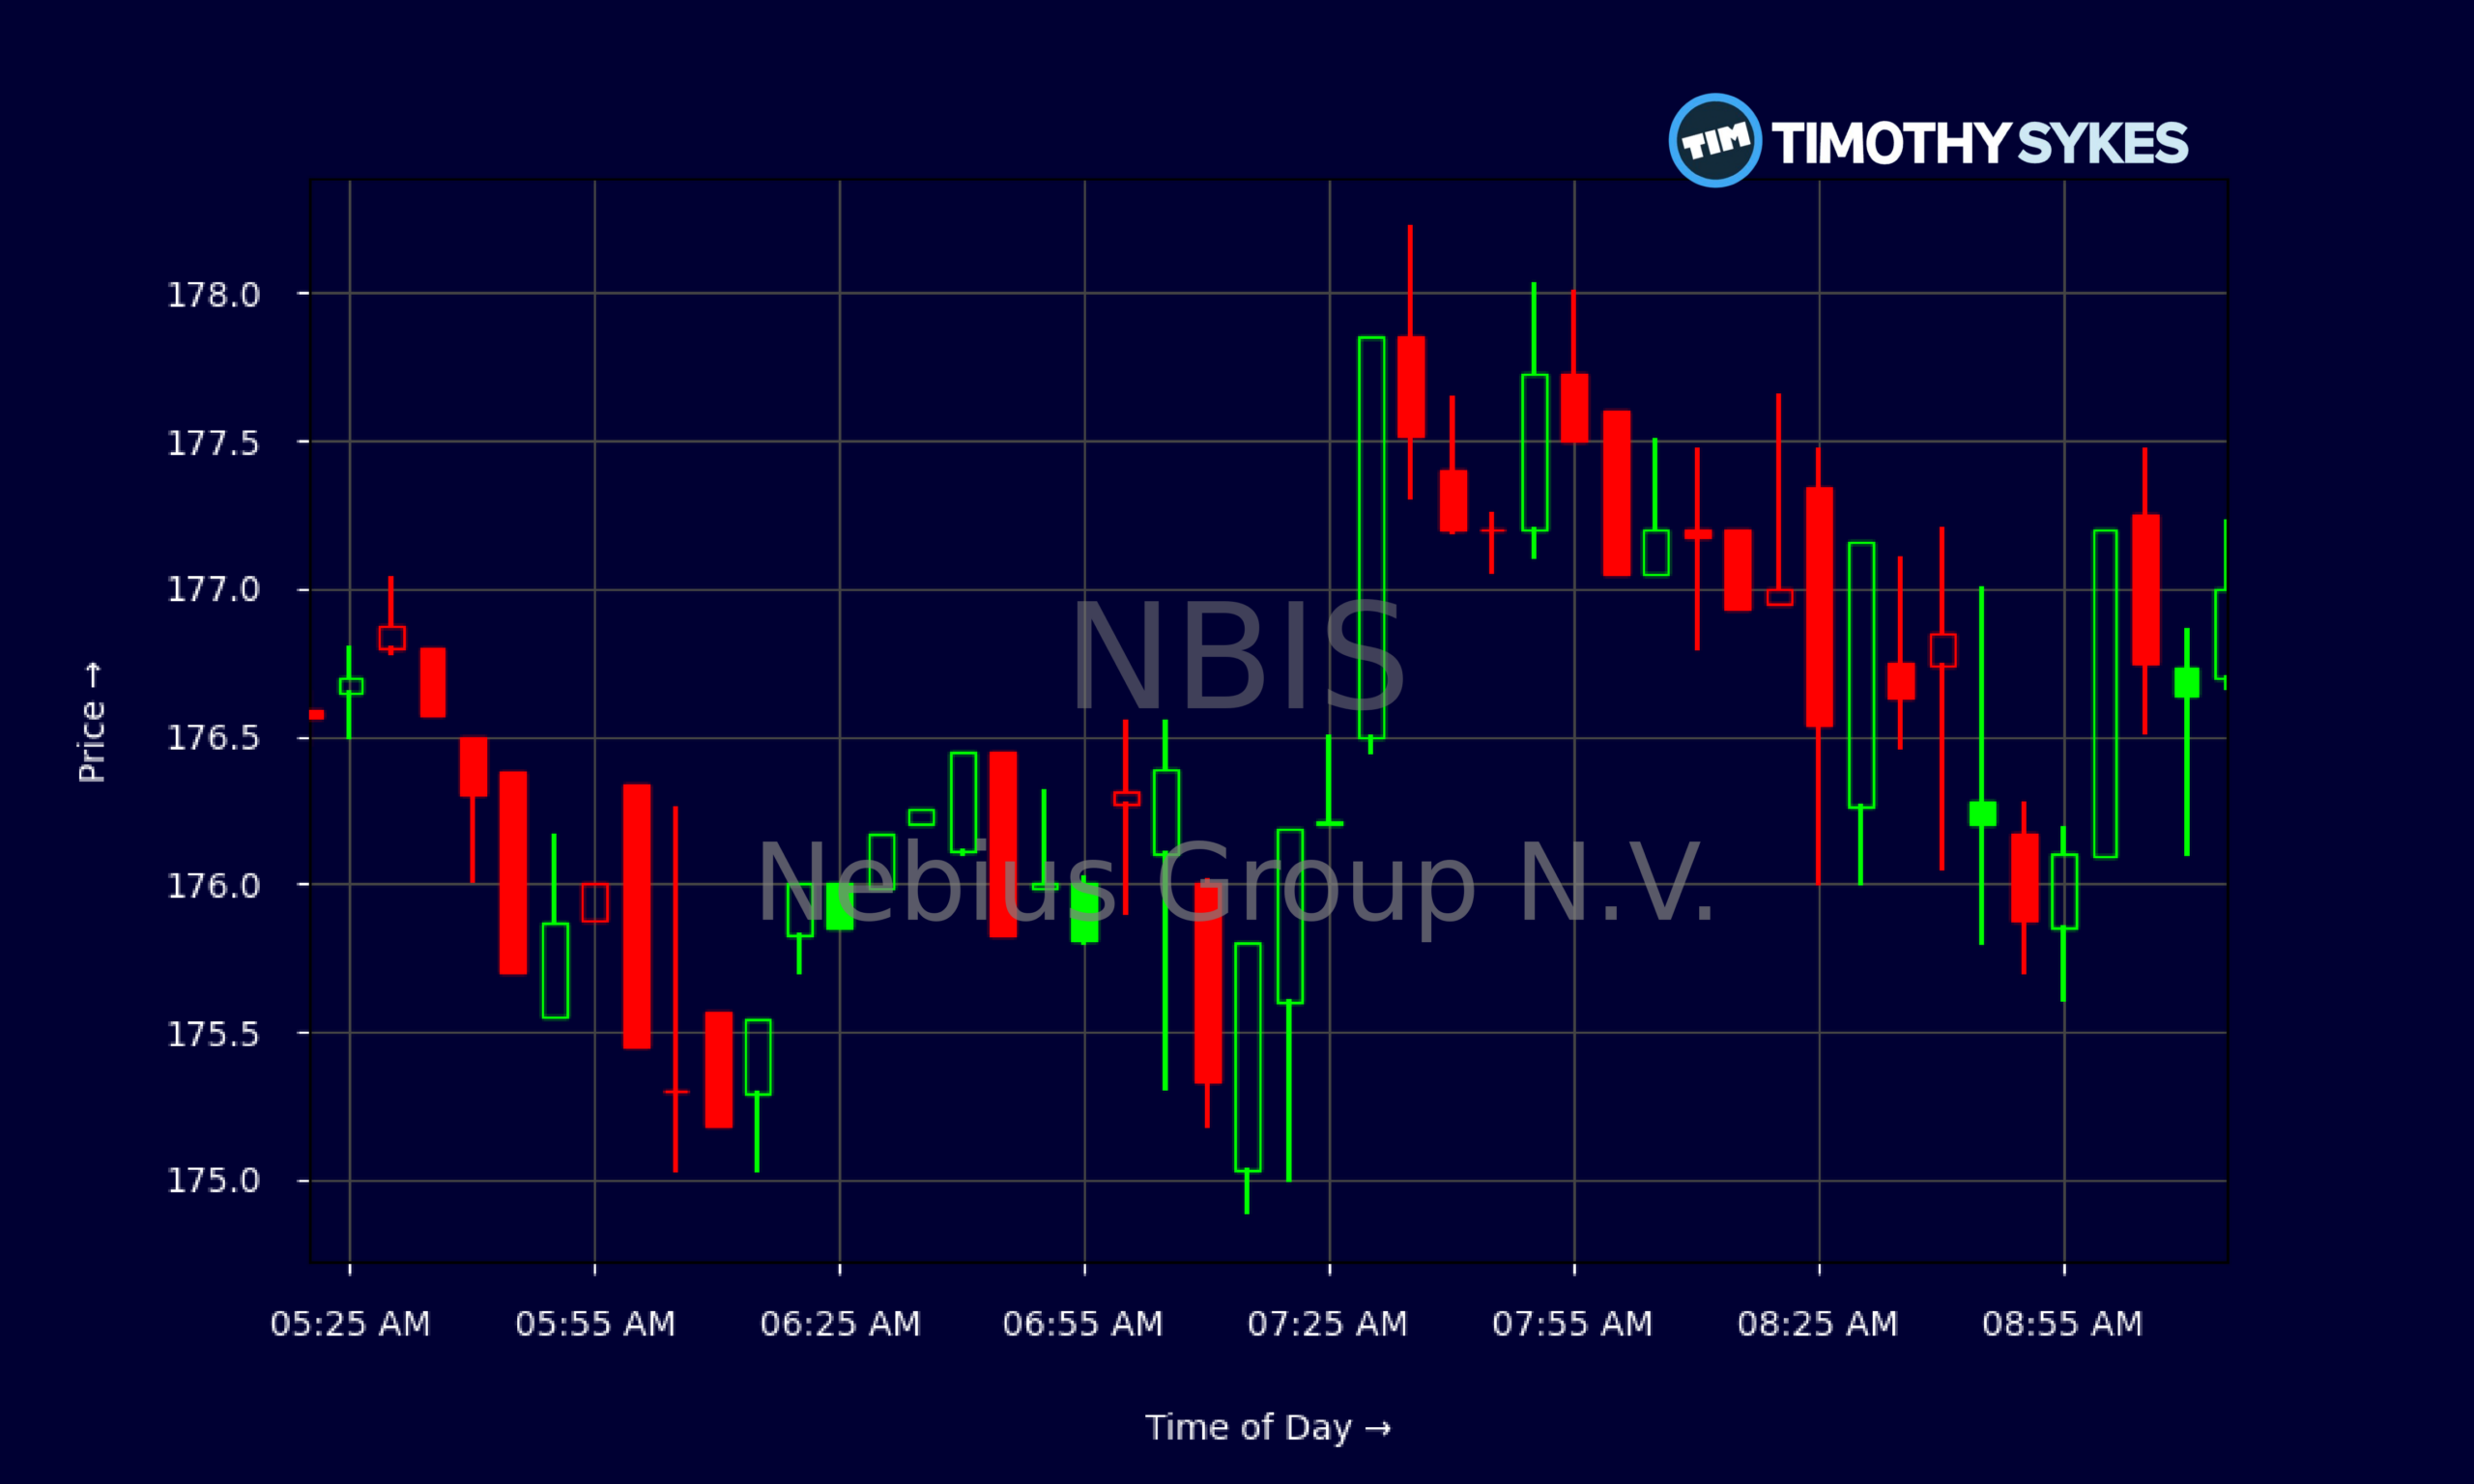
Live Update At 09:18:31 EDT: On Wednesday, October 21, 2026 Nebius Group N.V. stock [NASDAQ: NBIS] is trending up by 3.25%! Discover the key drivers behind this movement as well as our expert analysis in the detailed breakdown below.
Quick Financial Overview
Nebius Group N.V., trading under ticker NBIS, has been on a wild price ride. Over recent weeks, NBIS slid from the mid‑$240s to around $171.45, a sharp pullback that wipes out a big chunk of prior AI hype. Daily candles show heavy selling from late September into October, with NBIS dropping from about $249.87 on 2026/10/06 to $171.45 by 2026/10/20. That’s a deep correction.
Intraday, though, NBIS looks more controlled. The 5‑minute data around the latest premarket session clusters tightly in the mid‑$170s, with tiny ranges between $175 and $178. That tells traders the fast money has cooled for the moment, giving the stock a chance to build a base.
More Breaking News
Fundamentals for Nebius Group NBIS are extreme. Revenue is roughly $529.8M, but a price‑to‑sales ratio above 9,500 and price‑to‑book north of 1,100 scream “hyper‑growth expectations.” Return on assets is negative, and pretax margins are slightly below zero, so NBIS is not a profit story yet. At the same time, Nebius Group carries solid cash of about $3.68B against total assets of $12.43B and equity of $4.59B, suggesting it has resources to keep scaling AI infrastructure. For traders, NBIS is a high‑expectation, high‑volatility AI cloud name where sentiment can swing quickly.
Why Traders Are Watching NBIS Right Now
Nebius Group NBIS is sitting at the crossroads of two powerful themes: real AI cloud fundamentals and pure meme momentum. On the business side, Nebius Group has posted 454% year‑over‑year revenue growth and reports multi‑billion‑dollar deferred revenue. That deferred line is key. It reflects contracted business not yet recognized as revenue, which gives NBIS a backlog‑like cushion that many AI names do not have. For traders, that’s the difference between a story stock and a scaling platform.
On top of that, Nebius Group NBIS just locked in a 50‑MW capacity commitment at AIB’s southeastern U.S. data center. This 12‑year deal secures scarce power and rack space in a region where “time‑to‑power” is a real bottleneck for AI training and inference. When the market saw that news on 2026/09/30, NBIS traded higher premarket, showing traders were willing to reward long‑term AI infrastructure bets, not just headlines.
Nebius Group also closed the acquisition of Inferize, an AI infrastructure startup with tech that speeds up the launch and scaling of large AI models. NBIS shares moved up about 1.2% on that deal. The reaction was modest, but it confirmed that the market views the acquisition as on‑strategy. Inferize gives Nebius Group NBIS better tooling for customers in scientific and healthcare AI workloads, where speed to deployment can win or lose large contracts.
Now layer in the meme angle. NBIS has repeatedly posted 2%+ premarket gains after prior‑session strength, becoming one of the stronger Wallstreetbets names. At times, Nebius Group NBIS has rebounded 2.8% premarket after a 7.4% slide, purely on retail sentiment rather than fresh company news. That means liquidity spikes, spreads can widen, and intraday ranges can explode. Traders who study the chart and the tape can ride those waves, but anyone late to the move risks getting trapped at the top.
Conclusion
Nebius Group NBIS is a classic modern market battleground: real AI cloud scale meeting message‑board hype. On the one hand, the company shows 454% revenue growth, multi‑billion deferred revenue, and billions in cash on the balance sheet. Long‑term power and capacity commitments like the 50‑MW AIB deal support the idea that Nebius Group is planning a decade‑long run at AI infrastructure, not a quick flip. The Inferize acquisition fits that script, tightening Nebius Group NBIS’s toolset for large AI models and potentially deepening relationships in scientific and healthcare workloads.
On the other hand, the chart tells traders a different story: NBIS has broken hard from the $240–$250 zone down toward the $170 area, with sharp meme‑driven bounces along the way. Wallstreetbets energy has turned Nebius Group into a momentum playground, where 7.4% drops and 2.8% premarket rebounds can appear back‑to‑back with little change in fundamentals.
For active traders, that combination demands discipline. As Tim Sykes likes to say, “The market doesn’t owe you anything — you’re a hunter, not a victim.” As millionaire penny stock trader and teacher Tim Sykes, says, “There is always another play around the corner; don’t chase just because you feel FOMO.”. With NBIS, that means treating every spike as a potential trading setup, not a promise. Study the news, track volume, map key support and resistance, and always have an exit plan. This coverage of Nebius Group N.V. and NBIS is for educational and research purposes only, and every trader must make their own decisions and manage their own risk.
This is stock news, not investment advice. Timothy Sykes News delivers real-time stock market news focused on key catalysts driving short-term price movements. Our content is tailored for active traders and investors seeking to capitalize on rapid price fluctuations, particularly in volatile sectors like penny stocks. Readers come to us for detailed coverage on earnings reports, mergers, FDA approvals, new contracts, and unusual trading volumes that can trigger significant short-term price action. Some users utilize our news to explain sudden stock movements, while others rely on it for diligent research into potential investment opportunities.
Dive deeper into the world of trading with Timothy Sykes, renowned for his expertise in penny stocks. Explore his top picks and discover the strategies that have propelled him to success with these articles:
- Penny Stocks Trading Guide
- Best Penny Stocks Under $1 to Buy Today
- Top 8 Penny Stocks to Watch on Robinhood
Once you’ve got some stocks on watch, elevate your trading game with StocksToTrade the ultimate platform for traders. With specialized tools for swing and day trading, StocksToTrade will guide you through the market’s twists and turns.
Dig into StocksToTrade’s watchlists here:




Leave a reply