

Mohawk Industries Inc. stocks have been trading up by 6.93 percent following optimistic coverage of its resilient housing-related demand.
What Traders Need To Know
- Melius Research initiated coverage of Mohawk Industries with a Buy rating and a $188 price target, signaling meaningful upside from current trading levels.
- Q3 adjusted EPS of $2.72 topped the $2.58 consensus, while revenue of $2.79B came in just below the $2.82B estimate, highlighting margin strength despite soft demand.
- The board approved a new $500M share repurchase program after retiring about 7% of shares under the prior $500M plan at an average price of roughly $119.
- Management outlined roughly $375M in annual baseline CapEx focused on high-return organic projects, disciplined bolt-on M&A, and continued buybacks.
- Leadership reaffirmed a strong balance sheet stance with a long-term net debt to adjusted EBITDA target of up to 2.0x and guided Q4 adjusted EPS to $1.35–$1.45.
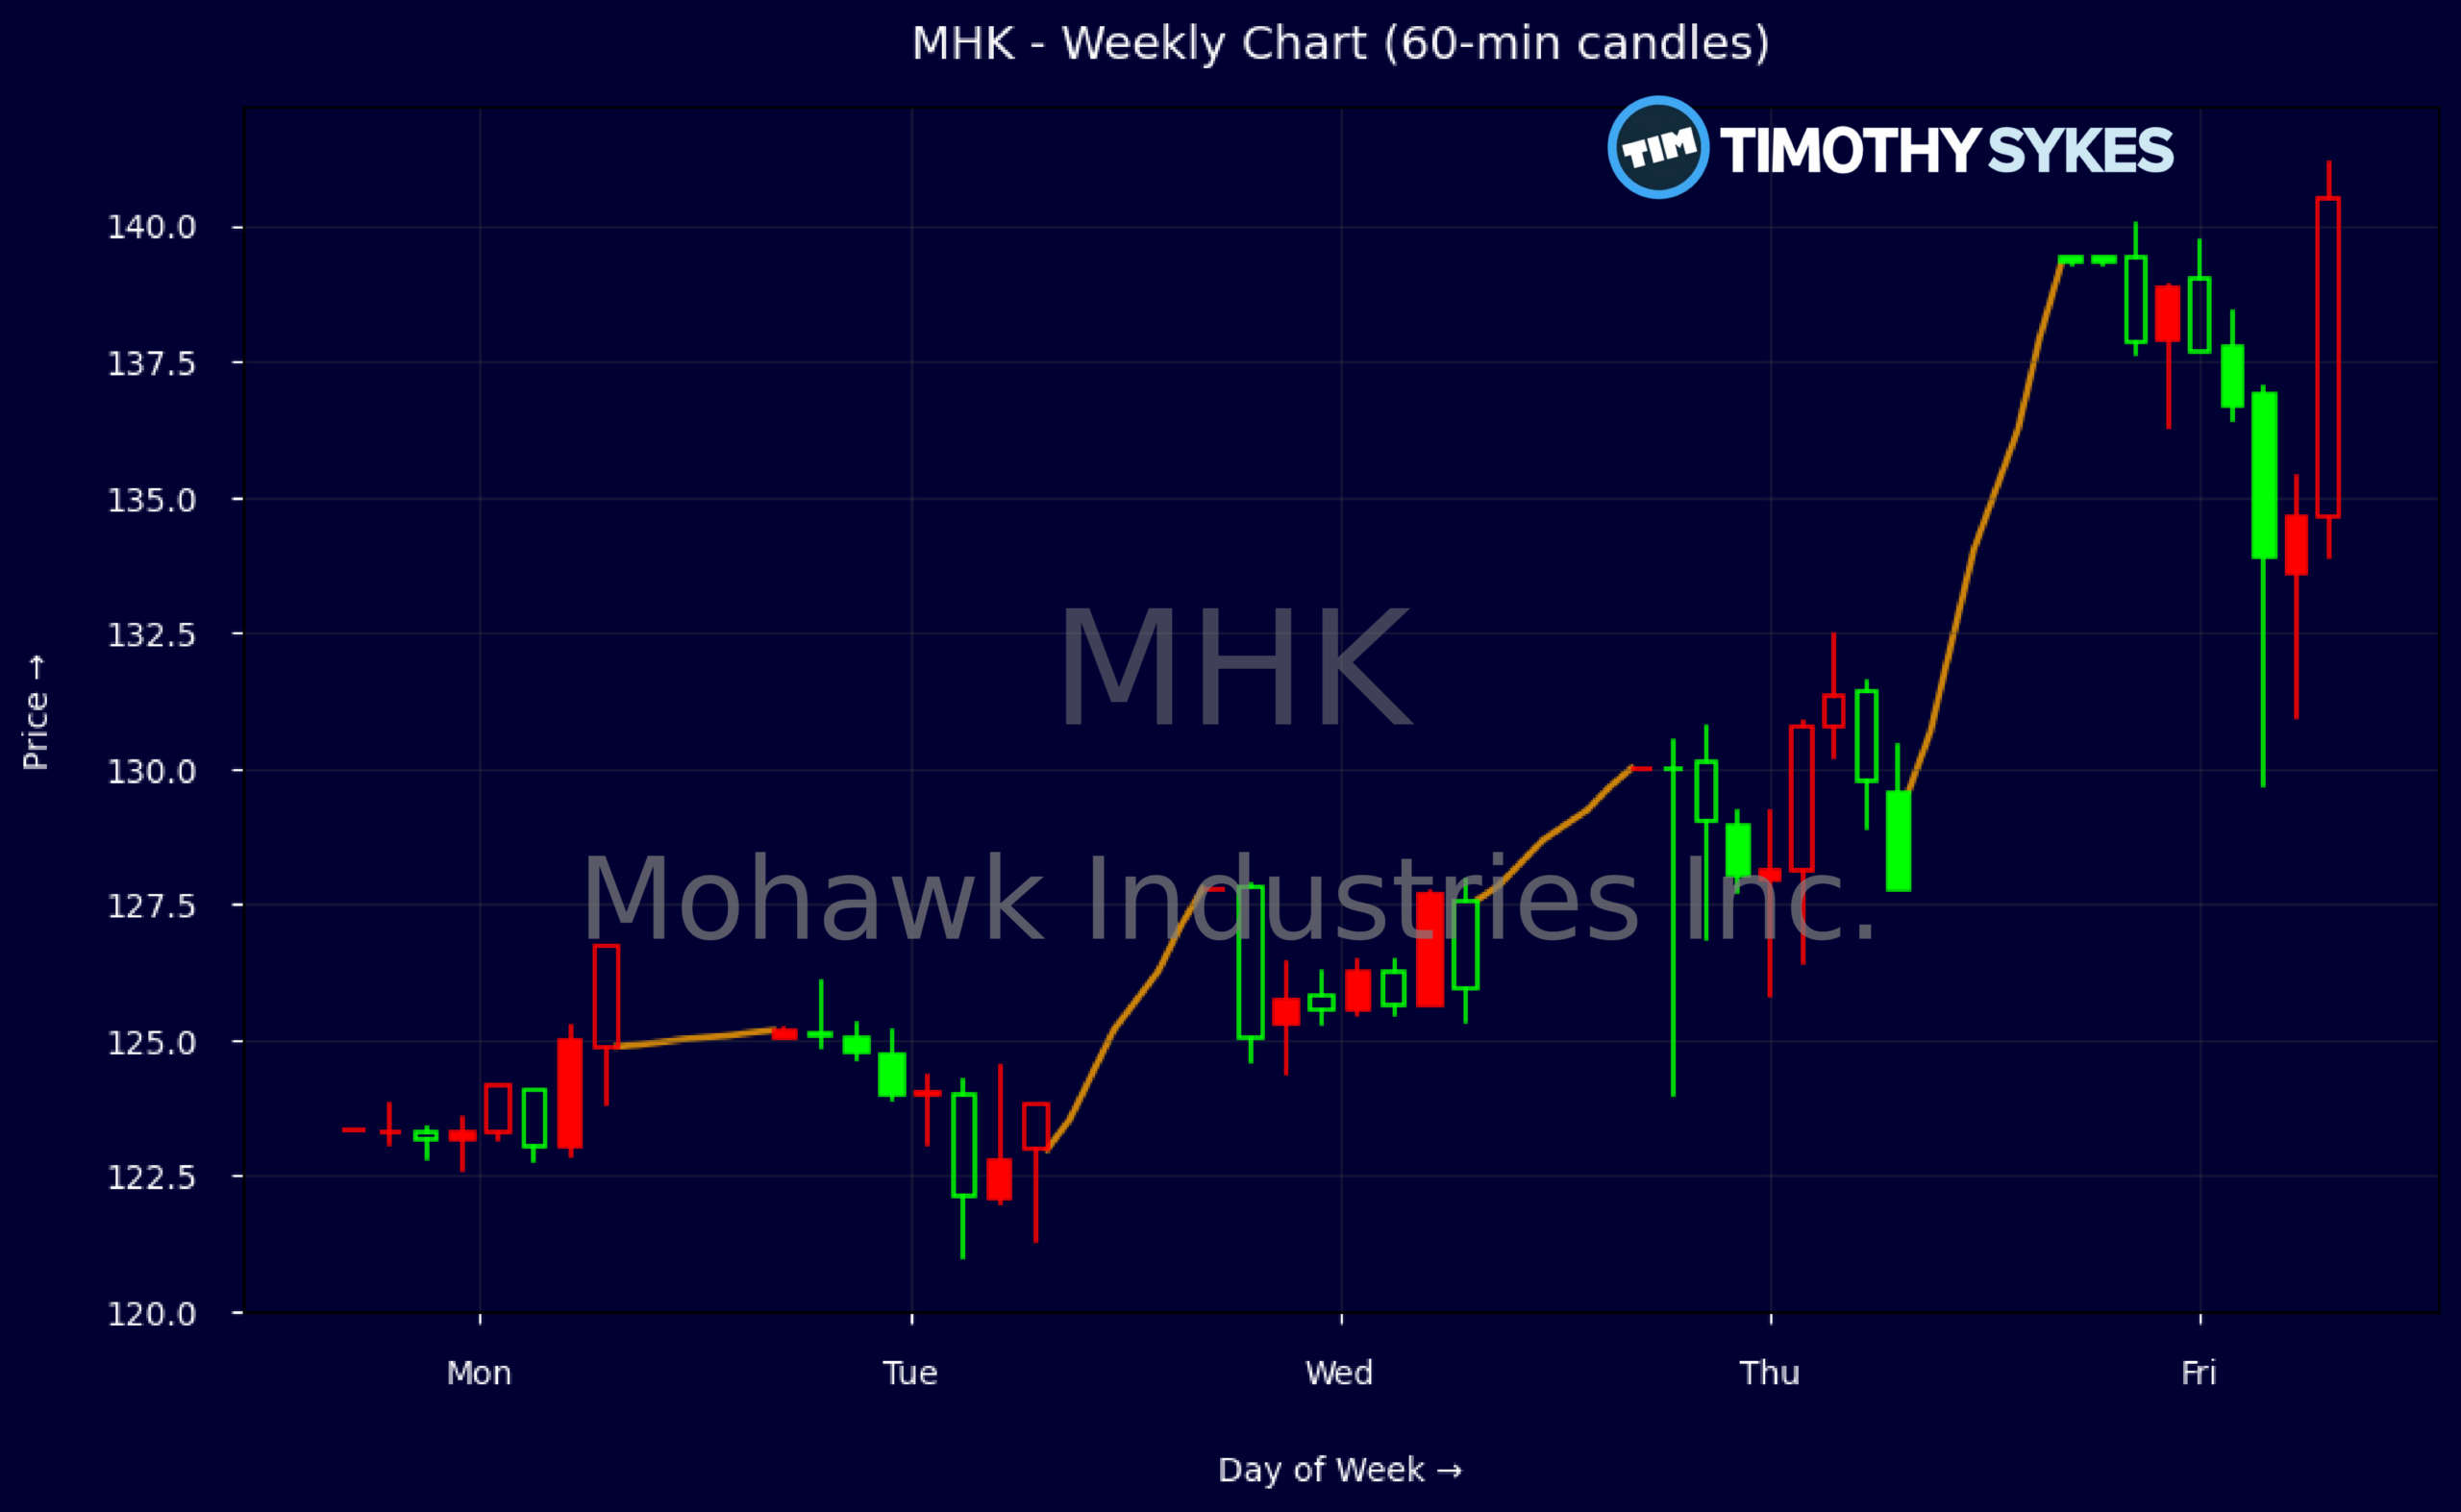
Weekly Update Oct 26 – Oct 30, 2026: On Friday, October 30, 2026 Mohawk Industries Inc. stock [NYSE: MHK] is trending up by 6.93%! Discover the key drivers behind this movement as well as our expert analysis in the detailed breakdown below.
Consumer Discretionary industry expert:
Analyst sentiment – positive
Mohawk holds a solid but cyclical #1–2 share position across flooring, with Q2 revenue of ~$2.99B and trailing sales of ~$10.8B in a flat-to-down demand environment (3-year revenue CAGR -0.4%). Margins remain compressed (EBIT margin 4.1%, EBITDA margin 10.2%, ROE ~5.5%), but Q2 EBIT of $253M shows gradual recovery. Valuation is undemanding at ~0.7x sales, ~0.9x book, and ~6–7x cash flow, underpinned by a strong balance sheet (net debt/EBITDA well under 2x, interest coverage >80x).
Technically, the stock has broken out sharply: from $123–125 early week to a $139.41 close, with a wide intraday range on 10/29 ($124 low to $130.50 high) confirming aggressive dip buying. Recent 5-minute action shows sustained bids and elevated volume into the close, not exhaustion. The dominant trend is short-term bullish. A specific actionable level: $129–130 is now key support; above it, pullbacks are buyable with initial upside targeting the mid-$140s.
Fundamentally, Mohawk is inflecting ahead of the broader Consumer Discretionary and Home/Homeware cohorts, which still face weaker earnings momentum and higher leverage. EPS beats, strong FCF ($228M Q2 FCF), and a new $500M buyback after retiring 7% of shares at ~$119 signal clear management confidence. Guidance acknowledges soft demand, but capital allocation (CapEx ~$375M, net leverage ceiling 2x) is disciplined. I view the risk/reward as attractive: buy with a 12–18 month target of $175, support $129, resistance $150.
More Breaking News
Quick Financial Overview
Mohawk Industries Inc. just printed a classic “earnings beat, revenue wobble” quarter that short-term traders see often. Adjusted EPS of $2.72 beat the $2.58 consensus, even though revenue of $2.79B missed the $2.82B estimate by a narrow margin. Management credited price increases, productivity, and strong cash conversion, while warning that demand stays weak and costs elevated. For traders, that mix usually supports the downside in the near term but can cap aggressive upside until volume trends improve.
On valuation, MHK trades around a price-to-earnings ratio of 15.62 and a price-to-sales ratio near 0.72, with price-to-book at 0.94. Those numbers point to a stock priced below its accounting value and below 1x sales, which often attracts value-focused capital when paired with solid cash flow. Gross margin of 24.3% and EBITDA margin above 10% show there is real earning power, even in a soft backdrop. Returns on equity in the mid-single digits tell you this is not a high-ROE growth story right now, but there is room for operating leverage if volumes rebound.
Balance-sheet risk looks controlled. Total debt to equity sits at 0.28, with interest coverage above 80x and a current ratio of 1.9, matching management’s public stance on protecting an investment-grade profile and keeping net debt to adjusted EBITDA at or below 2.0x. Cash flow backs that up: recent free cash flow of about $228.2M versus capital expenditures of roughly $88.3M shows room to both invest and buy back stock. The new $500M repurchase after already retiring roughly 7% of shares around $119 is a strong tell that management views current levels as attractive.
On the tape, the weekly data show MHK climbing from the low $120s to roughly $139.41 in a handful of sessions, a clean trend higher with higher highs and higher lows. Intraday, the 5-minute chart around the latest move shows a strong push off the open from about $138.32, a dip into the low $130s, and then steady buying pressure back toward the high $130s and low $140s into the close. That kind of intraday recovery, finishing near the highs with closing prints around $139.41, often signals that dip buyers are in control after the earnings and buyback news. For active traders, the $135–$136 area now looks like a key intraday support band, with $140–$141 as the first resistance zone to watch for potential breakouts or failed pushes.
Conclusion
Mohawk Industries Inc. is sending a clear message after this earnings release: management is willing to lean on pricing, productivity, and heavy buybacks while riding out weak demand. The Q3 EPS beat, solid free cash flow, and the fresh $500M repurchase authorization, on top of retiring roughly 7% of the float at about $119, all line up with that story. The formal capital allocation framework, with about $375M in annual baseline CapEx and tight leverage targets, adds structure that many institutional traders like to see.
For short-term traders, the recent surge from the low $120s to the high $130s puts MHK in a momentum phase, but after a move of that size, chasing breakouts without a plan is dangerous. The intraday action shows buyers supporting dips, yet management’s own Q4 EPS guidance of $1.35–$1.45 reminds you that earnings will likely step down from Q3. That creates a classic push-pull: bullish capital returns and valuation support versus cyclical softness and cost pressure.
This sets up MHK as a tactical trading name rather than a blind buy-and-hold at current levels. Traders may want to track how the stock behaves around the $135–$136 support band and whether it can hold above recent highs near $140–$141 on volume after the news settles. As millionaire penny stock trader and teacher Tim Sykes, says, “It’s not about how much money you make; it’s about how much money you keep.”. As I tell my students, “Price tells you who is winning today, but risk management decides who is still in the game tomorrow.”
This is stock news, not investment advice. Timothy Sykes News delivers real-time stock market news focused on key catalysts driving short-term price movements. Our content is tailored for active traders and investors seeking to capitalize on rapid price fluctuations, particularly in volatile sectors like penny stocks. Readers come to us for detailed coverage on earnings reports, mergers, FDA approvals, new contracts, and unusual trading volumes that can trigger significant short-term price action. Some users utilize our news to explain sudden stock movements, while others rely on it for diligent research into potential investment opportunities.
Dive deeper into the world of trading with Timothy Sykes, renowned for his expertise in penny stocks. Explore his top picks and discover the strategies that have propelled him to success with these articles:
- Penny Stocks Trading Guide
- Best Penny Stocks Under $1 to Buy Today
- Top 8 Penny Stocks to Watch on Robinhood
Once you’ve got some stocks on watch, elevate your trading game with StocksToTrade the ultimate platform for traders. With specialized tools for swing and day trading, StocksToTrade will guide you through the market’s twists and turns.
Dig into StocksToTrade’s watchlists here:





Leave a reply