

Kaixin Holdings stocks have been trading up by 74.34 percent, driven by investor optimism over its latest strategic developments.
Key Takeaways
- Recent KXIN daily chart shows a violent spike from sub-$1 to above $5, followed by a sharp fade into the low-$1 range.
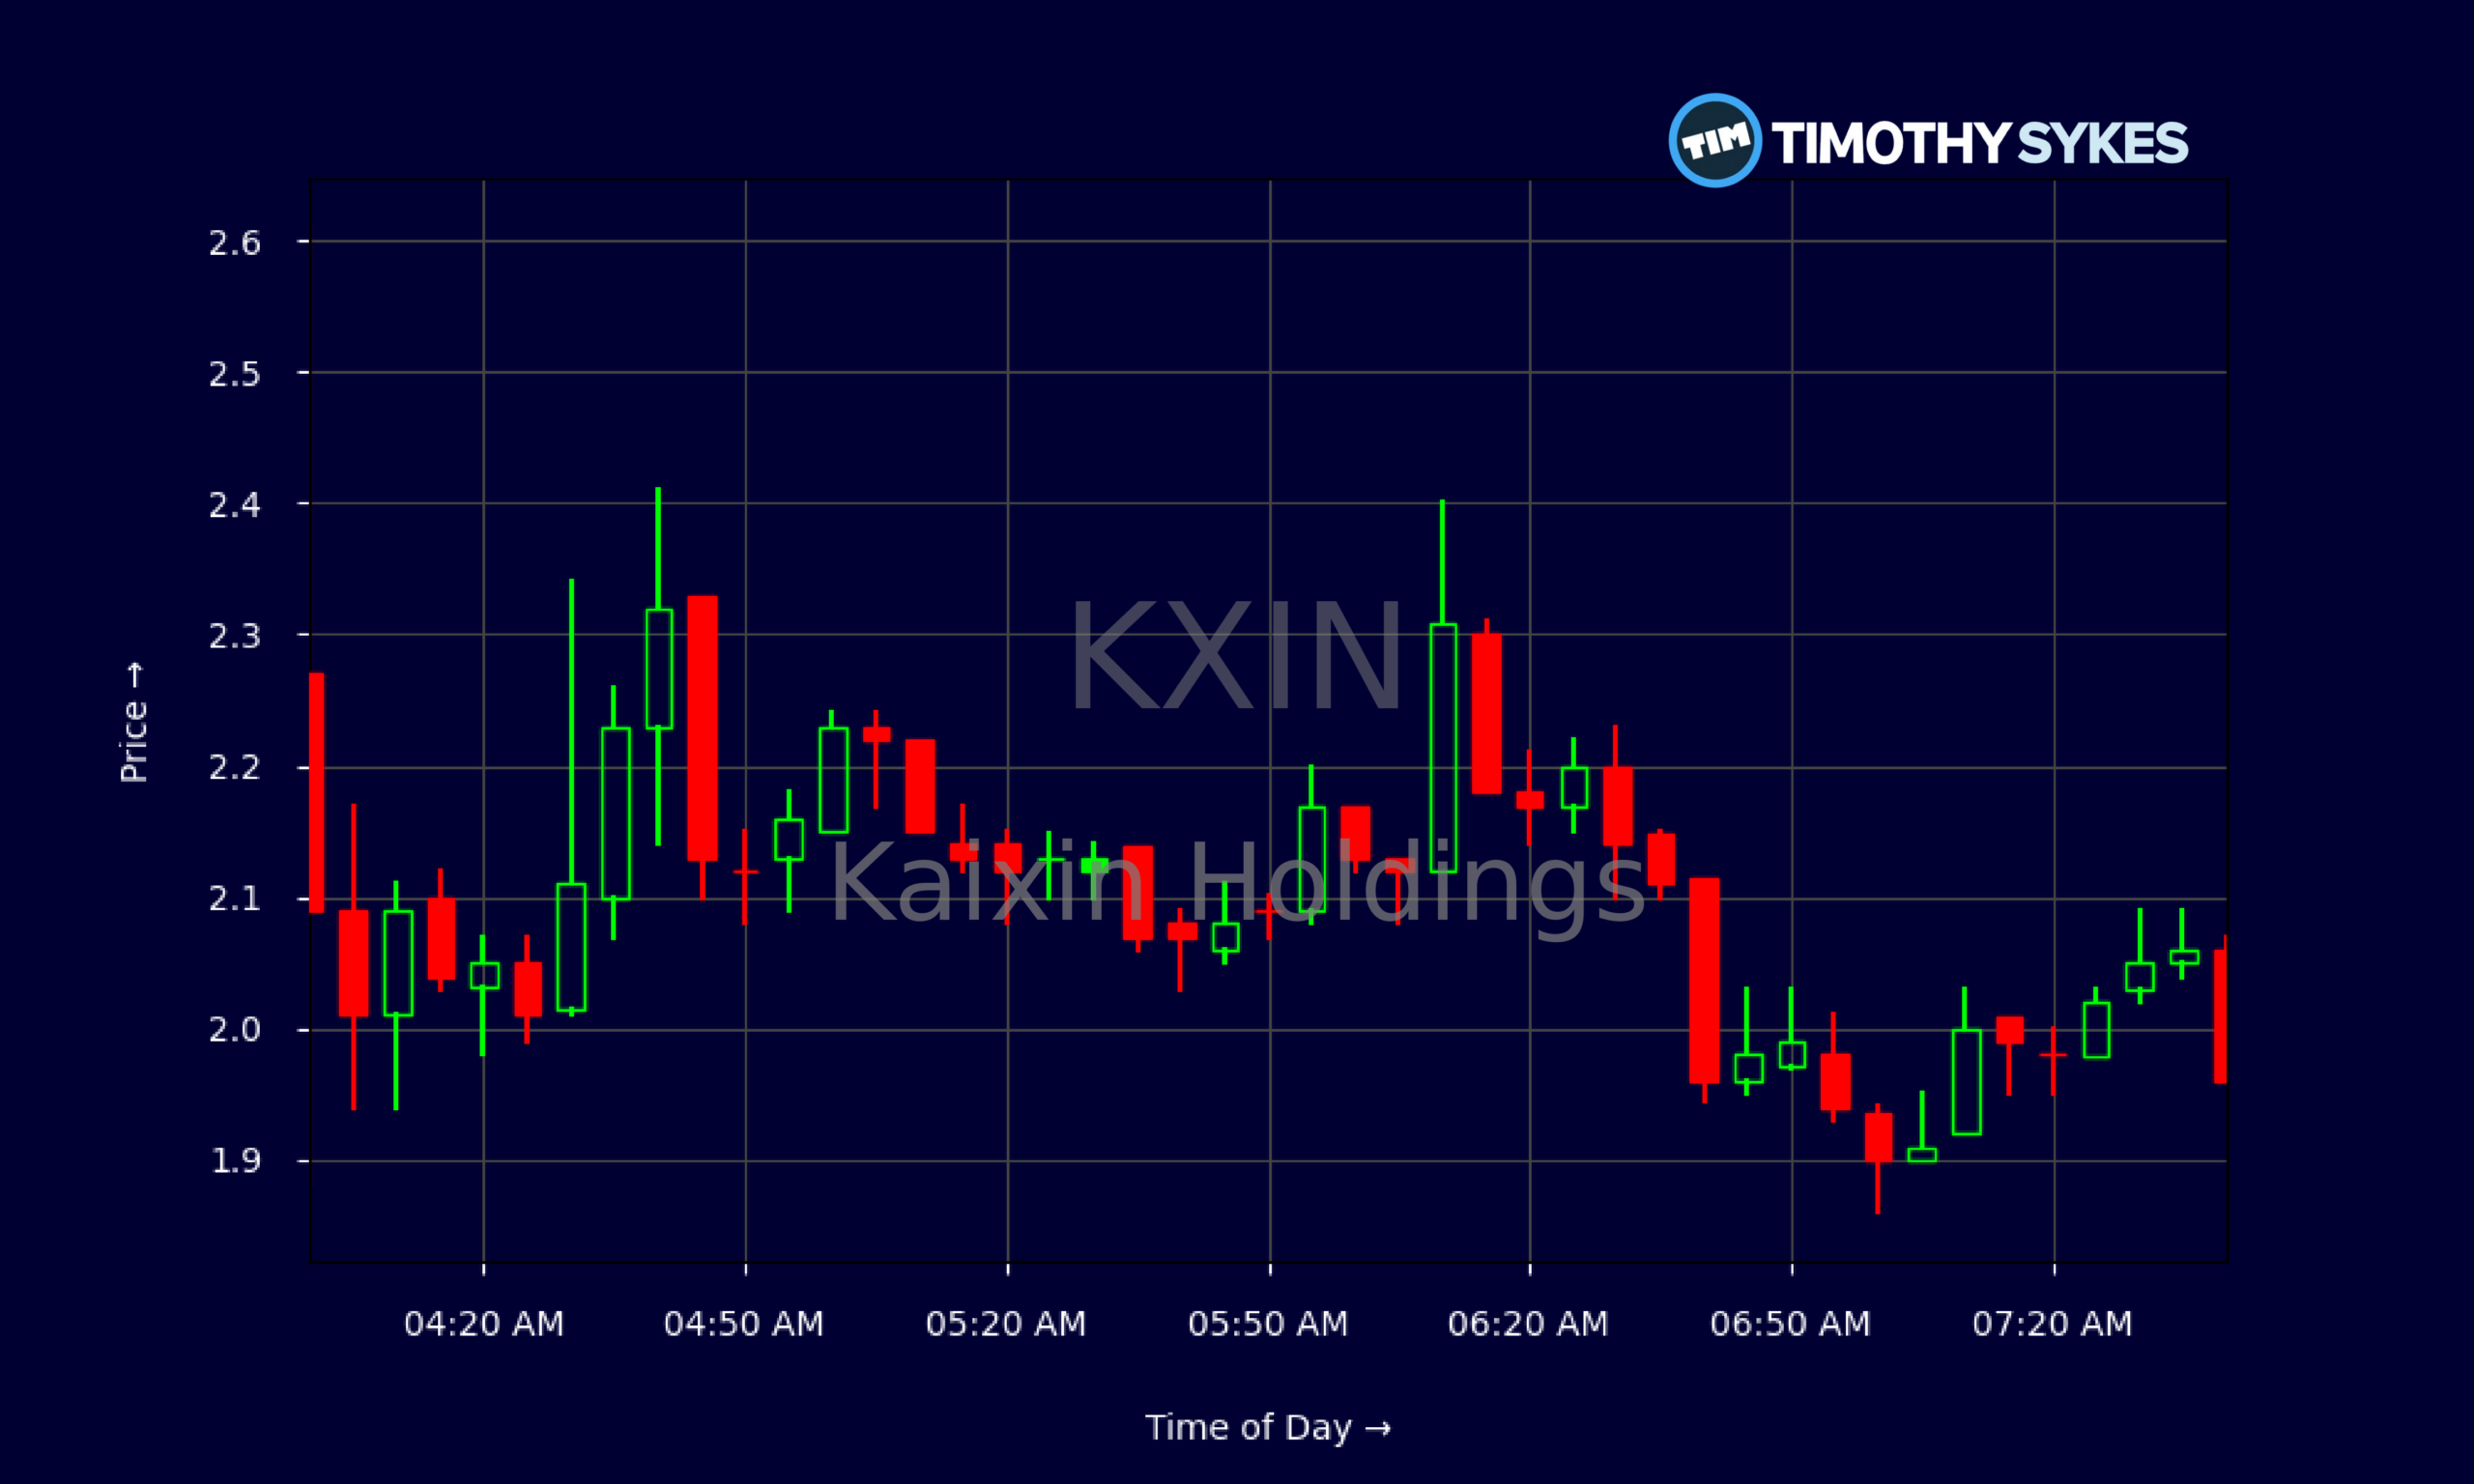
- Intraday action features heavy premarket volatility, with KXIN doubling off the prior close before pulling back and churning around $2.
- Kaixin Holdings runs a tiny revenue base against a relatively high market value, reflected in a steep price-to-sales ratio.
- The balance sheet leans heavily on goodwill and intangibles, while cash remains limited and working capital negative.
- Active traders are focusing on KXIN as a low-float momentum name where tight risk control is essential.
Live Update At 07:47:11 EDT: On Thursday, September 17, 2026 Kaixin Holdings stock [NASDAQ: KXIN] is trending up by 74.34%! Discover the key drivers behind this movement as well as our expert analysis in the detailed breakdown below.
Quick Financial Overview
Kaixin Holdings, trading under ticker KXIN, is a classic tiny-cap story stock. The company reports revenue of just $129,000, yet sports an enterprise value near $12.8M. That disconnect shows up in a sky-high price-to-sales ratio around 319. For traders, this means KXIN is being priced far more on hype and momentum than on current business output.
Book value per share sits near $0.55, while KXIN has recently changed hands in the $1–$2 range. That places the stock at roughly 1.9 times stated book value. On the surface that does not look extreme, but dig deeper and most of the asset base is goodwill and other intangibles, about $31.3M out of $33.0M in total assets. Tangible assets and cash are thin.
More Breaking News
Kaixin Holdings lists only 19 employees, a sign of a lean and likely fragile operation. Cash and equivalents total about $859,000, while current liabilities approach $8.96M, producing negative working capital of roughly $7.9M. That pressure, combined with a massive negative retained earnings balance, paints KXIN as a financially stressed, high-risk name that lends itself more to short-term trading than long-term holding.
Why Traders Are Watching KXIN’s Price Action
KXIN has earned a spot on many day-traders’ screens purely from the chart. In late August, Kaixin Holdings exploded from around $0.70 on 2026/08/28 to intraday highs above $5.70 on 2026/08/26, before closing that day near $5.22. Within a few trading days, KXIN slid back into the $1–$1.50 range. That kind of boom-and-bust pattern is exactly what momentum traders look for when scanning for low-float volatility.
Since that blow-off, daily candles show a steady grind lower. Closes have dropped from $1.49 on 2026/08/31 to $1.13 by 2026/09/16. Each bounce has been sold, with KXIN failing to reclaim prior resistance near $1.40–$1.50. For short-term traders, that zone now acts as a clear technical line in the sand. As long as Kaixin Holdings stays under it, the bias favors fading pops rather than chasing strength.
Zoom into the intraday 5-minute chart and the picture gets more aggressive. On the latest session, KXIN opened near $2.27 at 04:00 and ripped to $2.61 before dumping all the way to $1.88 in the same candle. That’s a full intraday range of more than 30% in minutes. After that washout, Kaixin Holdings kept swinging between roughly $1.90 and $2.30 through the premarket window.
This type of expanding range, combined with KXIN’s thin fundamentals, tells traders they’re dealing with a pure sentiment and liquidity play. There is enough range for both long and short setups, but only for those who respect tight stops, size small, and avoid getting married to any thesis.
Conclusion
KXIN sits at the crossroads of speculative trading and fragile fundamentals. On one side, Kaixin Holdings shows nearly $33.0M in assets, but the vast majority is goodwill and other intangibles, while retained earnings are deeply negative. Working capital is underwater, and reported revenue remains tiny. On the other side, the chart screams opportunity for disciplined day traders: huge gaps, sharp spikes, and deep pullbacks on both the daily and intraday time frames.
For traders who study KXIN, the key is separating story from structure. The structure here is clear. Kaixin Holdings is a low-priced, low-float name with extreme volatility, a stretched price-to-sales ratio, and a history of fast pumps followed by equally fast dumps. That can be fertile ground for those who plan every trade, predefine risk, and treat KXIN as a short-term vehicle, not a long-term parking spot for capital.
As Tim Sykes likes to say, “I’m not here to be right, I’m here to trade the price action and protect my account first.” As millionaire penny stock trader and teacher Tim Sykes says, “Small gains add up over time; focus on building wealth gradually, not chasing jackpots.”. KXIN is a live example of that mindset. The edge comes from respecting the risk, reacting to what the chart shows, and remembering that this is educational and research-focused trading — not a substitute for personal financial advice.
This is stock news, not investment advice. Timothy Sykes News delivers real-time stock market news focused on key catalysts driving short-term price movements. Our content is tailored for active traders and investors seeking to capitalize on rapid price fluctuations, particularly in volatile sectors like penny stocks. Readers come to us for detailed coverage on earnings reports, mergers, FDA approvals, new contracts, and unusual trading volumes that can trigger significant short-term price action. Some users utilize our news to explain sudden stock movements, while others rely on it for diligent research into potential investment opportunities.
Dive deeper into the world of trading with Timothy Sykes, renowned for his expertise in penny stocks. Explore his top picks and discover the strategies that have propelled him to success with these articles:
- Penny Stocks Trading Guide
- Best Penny Stocks Under $1 to Buy Today
- Top 8 Penny Stocks to Watch on Robinhood
Once you’ve got some stocks on watch, elevate your trading game with StocksToTrade the ultimate platform for traders. With specialized tools for swing and day trading, StocksToTrade will guide you through the market’s twists and turns.
Dig into StocksToTrade’s watchlists here:





Leave a reply