

Ibotta Inc. stocks have been trading up by 22.35 percent amid strong investor enthusiasm for its recent IPO.
Key Takeaways
- IBTA has broken out from the mid-$40s to the low-$60s, with strong daily and intraday momentum attracting short-term traders.
- The latest quarter shows Ibotta Inc. growing revenue to about $88.9M, while still posting a small net loss.
- A fat 78% gross margin and a light debt load give Ibotta Inc. room to keep funding growth.
- Intraday action shows IBTA experiencing wide ranges and sharp swings, ideal for active momentum and dip-buying strategies.
Live Update At 14:02:27 EST: On Tuesday, November 03, 2026 Ibotta Inc. stock [NYSE: IBTA] is trending up by 22.35%! Discover the key drivers behind this movement as well as our expert analysis in the detailed breakdown below.
Quick Financial Overview
IBTA is acting like a classic young growth name: strong topline, choppy bottom line, and plenty of volatility for traders. Ibotta Inc. generated about $88.9M in revenue in the latest reported quarter, with gross profit near $69.7M thanks to a hefty 78.2% gross margin. That tells traders the core business has solid pricing power and low direct costs.
The flip side: IBTA still isn’t consistently profitable. Ibotta Inc. posted an operating loss of roughly $1.9M and a net loss of about $1.23M, or -$0.05 per share. Losses are modest relative to revenue, but they show the company is still in “build mode,” pouring money into selling, marketing, and product development.
More Breaking News
On the balance sheet, IBTA looks surprisingly sturdy for a momentum name. Ibotta Inc. holds about $148.2M in cash against roughly $25.1M of long-term debt, with a current ratio of 1.7. That cushion, plus low debt-to-equity around 0.1, gives Ibotta Inc. flexibility to weather rough quarters while pursuing growth. For traders, that combination — strong margins, manageable losses, and cash in the bank — often fuels speculative upside when momentum kicks in.
Why Traders Are Watching IBTA Price Action
IBTA’s chart is exactly what active traders hunt for. Over the last several weeks, Ibotta Inc. has climbed from the low-$40s to the low-$60s, with plenty of shakeouts along the way. The daily chart shows a steady stair-step from about $43 on 2026/10/14 up through the high-$40s and low-$50s, then a sharp surge into the $60s by 2026/11/03.
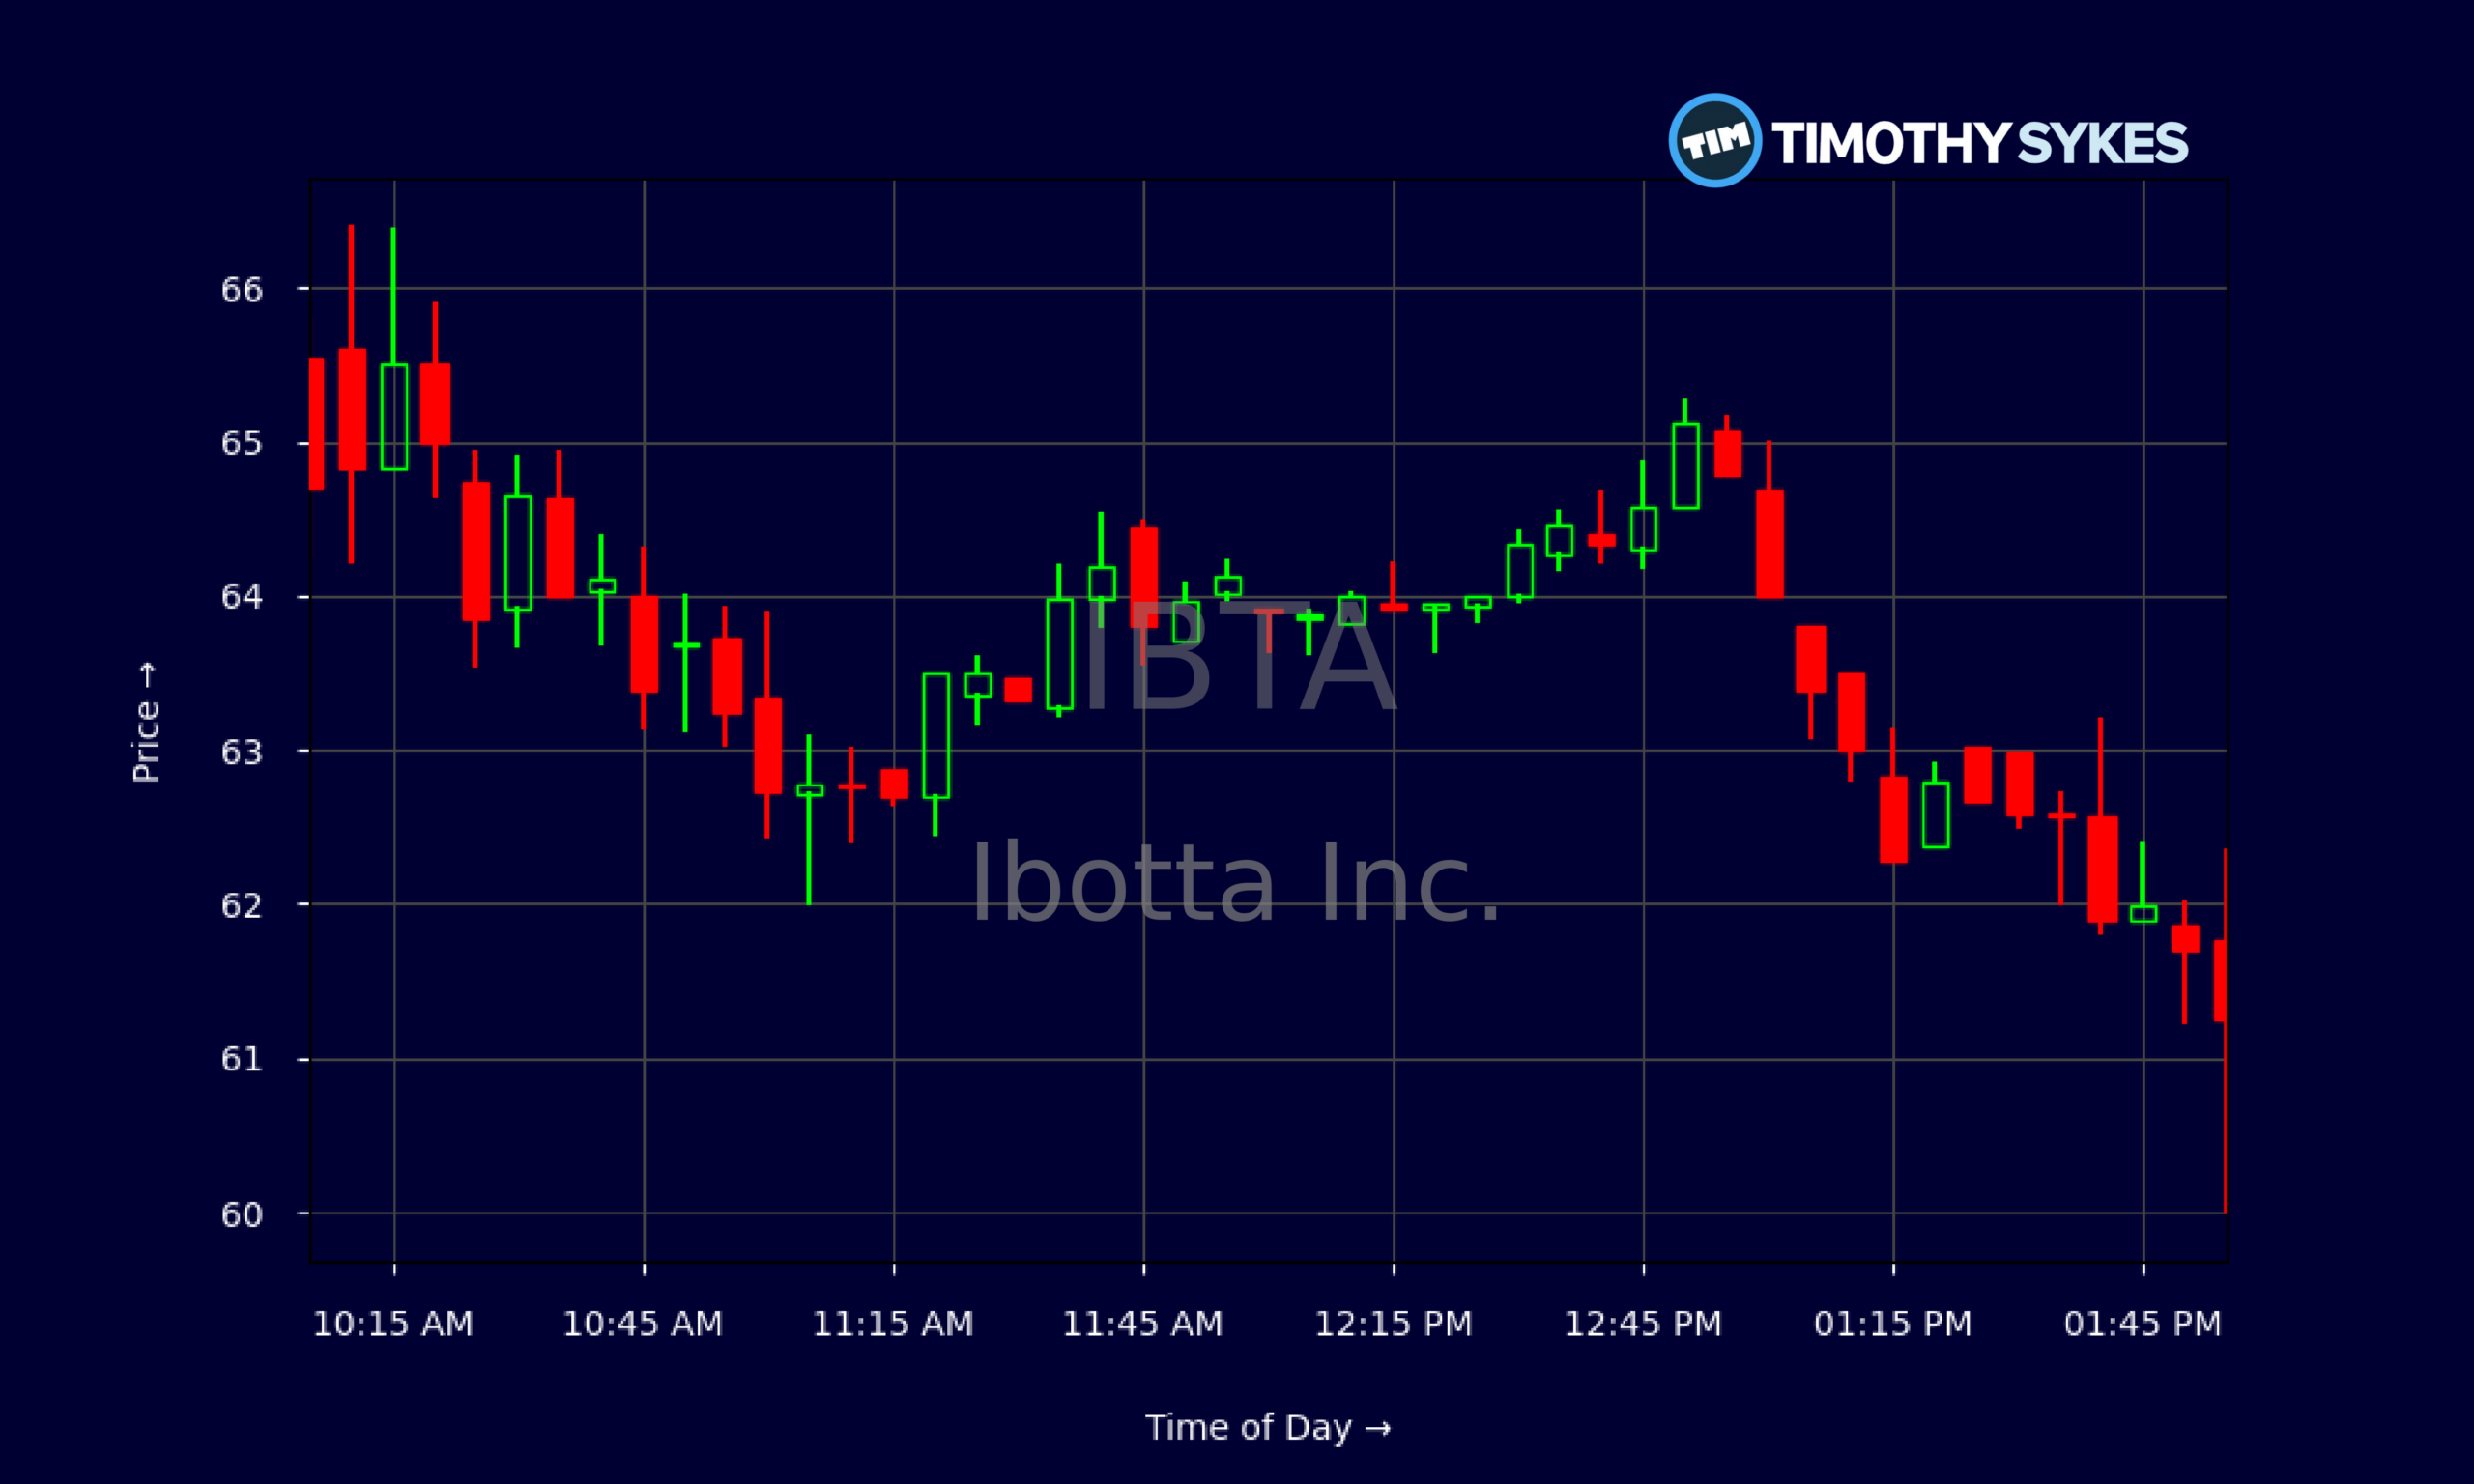
That 2026/11/03 candle stands out. IBTA opened near $58.72, flushed to the low-$53s, then ripped as high as $66.39 before closing around $61.16. For Ibotta Inc. traders, that’s a full intraday range of more than $13 — pure opportunity for breakout players and dip buyers who manage risk tightly.
Zoom into the 5-minute data and the story gets clearer. Early in the day, IBTA exploded from the high-$50s into the mid-$60s, then spent midday chopping between roughly $63 and $65 before fading slightly into the close. That kind of intraday expansion — big gap, early push, midday consolidation, and late-day churn — is textbook momentum behavior.
When you layer that onto Ibotta Inc.’s fundamentals, the price action makes sense. The market is willing to pay roughly 2.9 times sales and about 4.1 times book value for IBTA. Those are growth-style valuations, supported by high margins and a relatively clean balance sheet. Traders aren’t buying today because earnings are perfect; they’re trading IBTA because the story and the chart both point to a company still on offense.
Conclusion
IBTA sits at an interesting crossroads for active traders. On one hand, Ibotta Inc. is still losing a little money at the bottom line, with a recent net loss around $1.23M and negative net margins near -3.2%. On the other hand, the business is scaling, gross margins are strong, and the balance sheet shows roughly $148.2M in cash with limited leverage. That mix supports the kind of aggressive marketing and tech spending that has already driven revenue up to about $88.9M this quarter and $342.4M over the trailing period.
The chart tells the rest of the story. IBTA has broken out from a long base in the $40s and $50s to test the mid-$60s, with intraday swings wide enough to reward disciplined traders and punish bag-holders. This is the kind of setup that Tim Sykes’ community studies daily — strong trend, clean levels, and obvious spots to cut losses fast.
For anyone tracking Ibotta Inc., the key is not to fall in love with the story. Respect the volatility, watch the key support in the mid-to-high $50s, and don’t chase without a plan. As millionaire penny stock trader and teacher Tim Sykes, says, “Embrace the journey, the ups and downs; each mistake is a lesson to improve your strategy.”. As Tim Sykes likes to say, “The market doesn’t care about your opinion, it cares about price action — trade the chart, not the hype.” IBTA is giving traders a real-time lesson in exactly that.
This is stock news, not investment advice. Timothy Sykes News delivers real-time stock market news focused on key catalysts driving short-term price movements. Our content is tailored for active traders and investors seeking to capitalize on rapid price fluctuations, particularly in volatile sectors like penny stocks. Readers come to us for detailed coverage on earnings reports, mergers, FDA approvals, new contracts, and unusual trading volumes that can trigger significant short-term price action. Some users utilize our news to explain sudden stock movements, while others rely on it for diligent research into potential investment opportunities.
Dive deeper into the world of trading with Timothy Sykes, renowned for his expertise in penny stocks. Explore his top picks and discover the strategies that have propelled him to success with these articles:
- Penny Stocks Trading Guide
- Best Penny Stocks Under $1 to Buy Today
- Top 8 Penny Stocks to Watch on Robinhood
Once you’ve got some stocks on watch, elevate your trading game with StocksToTrade the ultimate platform for traders. With specialized tools for swing and day trading, StocksToTrade will guide you through the market’s twists and turns.
Dig into StocksToTrade’s watchlists here:





Leave a reply