

Heartflow, Inc. stocks have been trading up by 7.84 percent after positive coverage of its AI-driven cardiac imaging advances.
Key Takeaways
- Price action in HTFL shows a steady grind from the high-$40s into the mid-$50s, signaling growing momentum.
- Intraday trading in Heartflow, Inc. has been tight and controlled, with higher lows building a clear uptrend.
- Recent numbers show HTFL growing revenue but still running heavy losses as it scales.
- Heartflow, Inc. carries low debt and strong liquidity, giving traders confidence the story has runway.
- HTFL traders are focused on support in the low-$50s and potential breakout continuation above recent highs.
Live Update At 12:33:56 EDT: On Tuesday, October 20, 2026 Heartflow, Inc. stock [NASDAQ: HTFL] is trending up by 7.84%! Discover the key drivers behind this movement as well as our expert analysis in the detailed breakdown below.
Quick Financial Overview
HTFL is trading like a classic high-growth, high-burn name. On the income side, Heartflow, Inc. booked about $64.1M in total revenue for the latest quarter, with gross margin near 80%. That’s elite profitability on each dollar of sales. The problem is below the line. Operating expenses around $71.1M drove an operating loss of roughly $17.9M and net loss of about $15.7M, or -$0.18 per share. HTFL is not close to break-even yet.
For traders, the balance sheet matters more than the current loss. Heartflow, Inc. shows total assets of about $344.5M, with cash, equivalents, and short-term investments near $162.6M. Current liabilities are roughly $44.1M, giving HTFL a current ratio above 5. That’s a solid liquidity cushion.
More Breaking News
Debt sits low, with long-term obligations just above $20M and total liabilities near $64.7M. Yes, returns on assets and equity are deeply negative, reflecting the burn, but Heartflow, Inc. carries the cash to keep pushing growth. HTFL shares are priced rich versus sales, yet the strong gross margin and runway keep traders engaged in the growth thesis.
Why Traders Are Watching HTFL Price Action
On the chart, HTFL has been quietly building a stronger trend than many traders realize. Over the past several sessions, Heartflow, Inc. climbed from closes around $49 to a recent push above $55. The stock dipped to about $47–$48 on several days, yet every pullback attracted buyers and printed higher lows. That is the kind of staircase trend active traders want to ride.
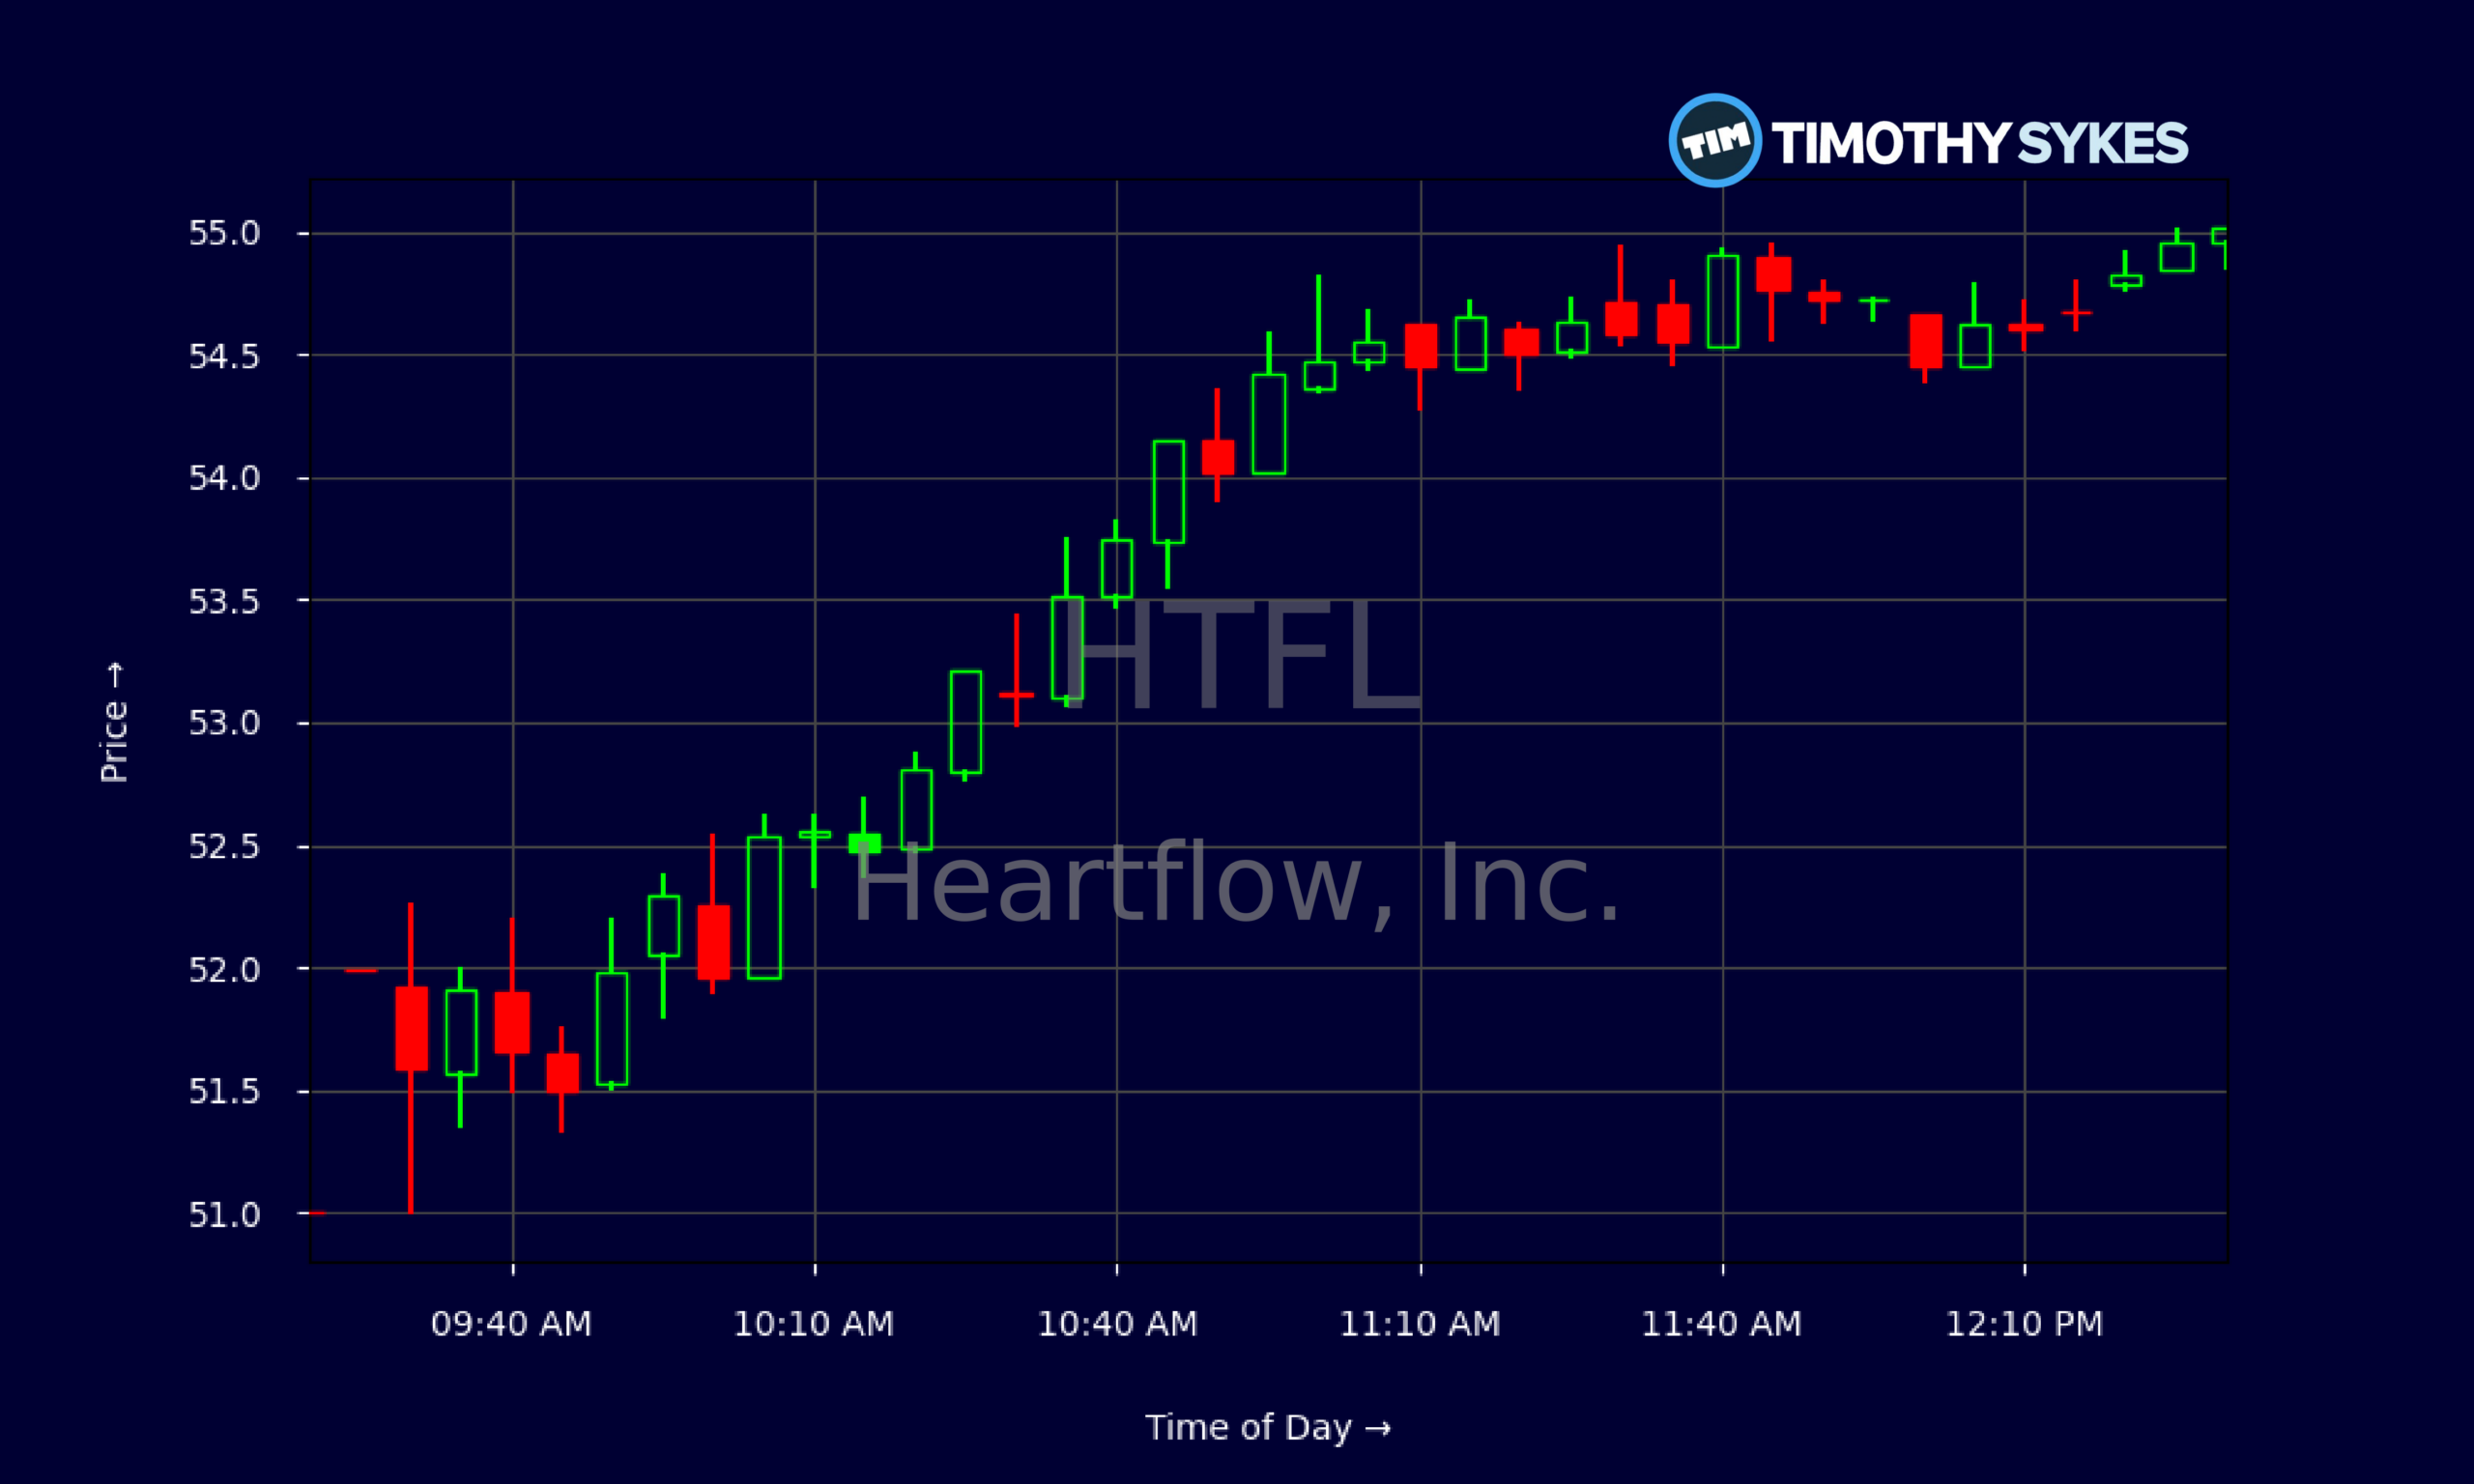
Look at the most recent day’s action. HTFL opened just above $51 and never revisited the premarket low of $51 for long. By the close, Heartflow, Inc. finished at the high of the day near $55.02. Intraday 5‑minute candles show a clean trend: early churn in the low-$52s, then a series of controlled pushes higher, very shallow dips, and tight consolidation near the highs. That’s strong hands in control.
For traders, this sort of grind is often more reliable than a single wild spike. HTFL is walking up resistance levels instead of sprinting through them. Each pause around $52, then $53, then $54 turned into a new base. If Heartflow, Inc. holds above the $52–$53 zone, momentum traders will keep leaning long on dips.
At the same time, HTFL’s fundamentals back the story. Rapid revenue, big gross margins, and a fat cash pile help justify the market giving Heartflow, Inc. a premium price-to-sales multiple. The losses are real, but the burn rate is funded for now. That’s why HTFL remains a go-to watch for growth-focused traders hunting liquid movers.
Conclusion
HTFL sits at an interesting crossroads for active traders. On one side, Heartflow, Inc. generates strong revenue growth with excellent gross margins, and the balance sheet shows plenty of cash, limited debt, and ample working capital. That gives HTFL flexibility to keep spending on sales growth and research without immediately worrying about a liquidity crunch.
On the other side, Heartflow, Inc. still posts steep negative margins and negative returns on capital. HTFL is paying heavily today for potential scale tomorrow. That tension between growth and losses is exactly what creates big swings and clean trading opportunities. When the market believes the growth story, HTFL trends like it has over the last several days, grinding from the high-$40s into the mid‑$50s. When that belief cracks, the same stock can unwind just as fast.
Traders in the HTFL community should focus on levels, not hopes. The key near term is whether Heartflow, Inc. can defend that $52–$53 support band and build a base above it. Upside momentum stays in play as long as higher lows hold and volume confirms strength on pushes toward and through recent highs. As millionaire penny stock trader and teacher Tim Sykes says, “Embrace the journey, the ups and downs; each mistake is a lesson to improve your strategy.” That mindset helps active traders stay process‑driven as they navigate HTFL’s volatility and refine their setups over time.
As Tim Bohen loves to remind traders, “Patterns repeat, but you have to do the work to recognize them and react without hesitation.” HTFL is offering a live case study in that idea right now. Study the chart, respect the risk, and let the price action in Heartflow, Inc. — not emotion — drive your trading plan.
This is stock news, not investment advice. Timothy Sykes News delivers real-time stock market news focused on key catalysts driving short-term price movements. Our content is tailored for active traders and investors seeking to capitalize on rapid price fluctuations, particularly in volatile sectors like penny stocks. Readers come to us for detailed coverage on earnings reports, mergers, FDA approvals, new contracts, and unusual trading volumes that can trigger significant short-term price action. Some users utilize our news to explain sudden stock movements, while others rely on it for diligent research into potential investment opportunities.
Dive deeper into the world of trading with Timothy Sykes, renowned for his expertise in penny stocks. Explore his top picks and discover the strategies that have propelled him to success with these articles:
- Penny Stocks Trading Guide
- Best Penny Stocks Under $1 to Buy Today
- Top 8 Penny Stocks to Watch on Robinhood
Once you’ve got some stocks on watch, elevate your trading game with StocksToTrade the ultimate platform for traders. With specialized tools for swing and day trading, StocksToTrade will guide you through the market’s twists and turns.
Dig into StocksToTrade’s watchlists here:





Leave a reply