

Gerdau S.A. stocks have been trading down by -8.24 percent amid bearish sentiment over weakening global steel demand and pricing.
Key Takeaways
- Price action in GGB shows a clear pullback from recent highs above $5.20, with the stock now hovering in the mid-$4 range.
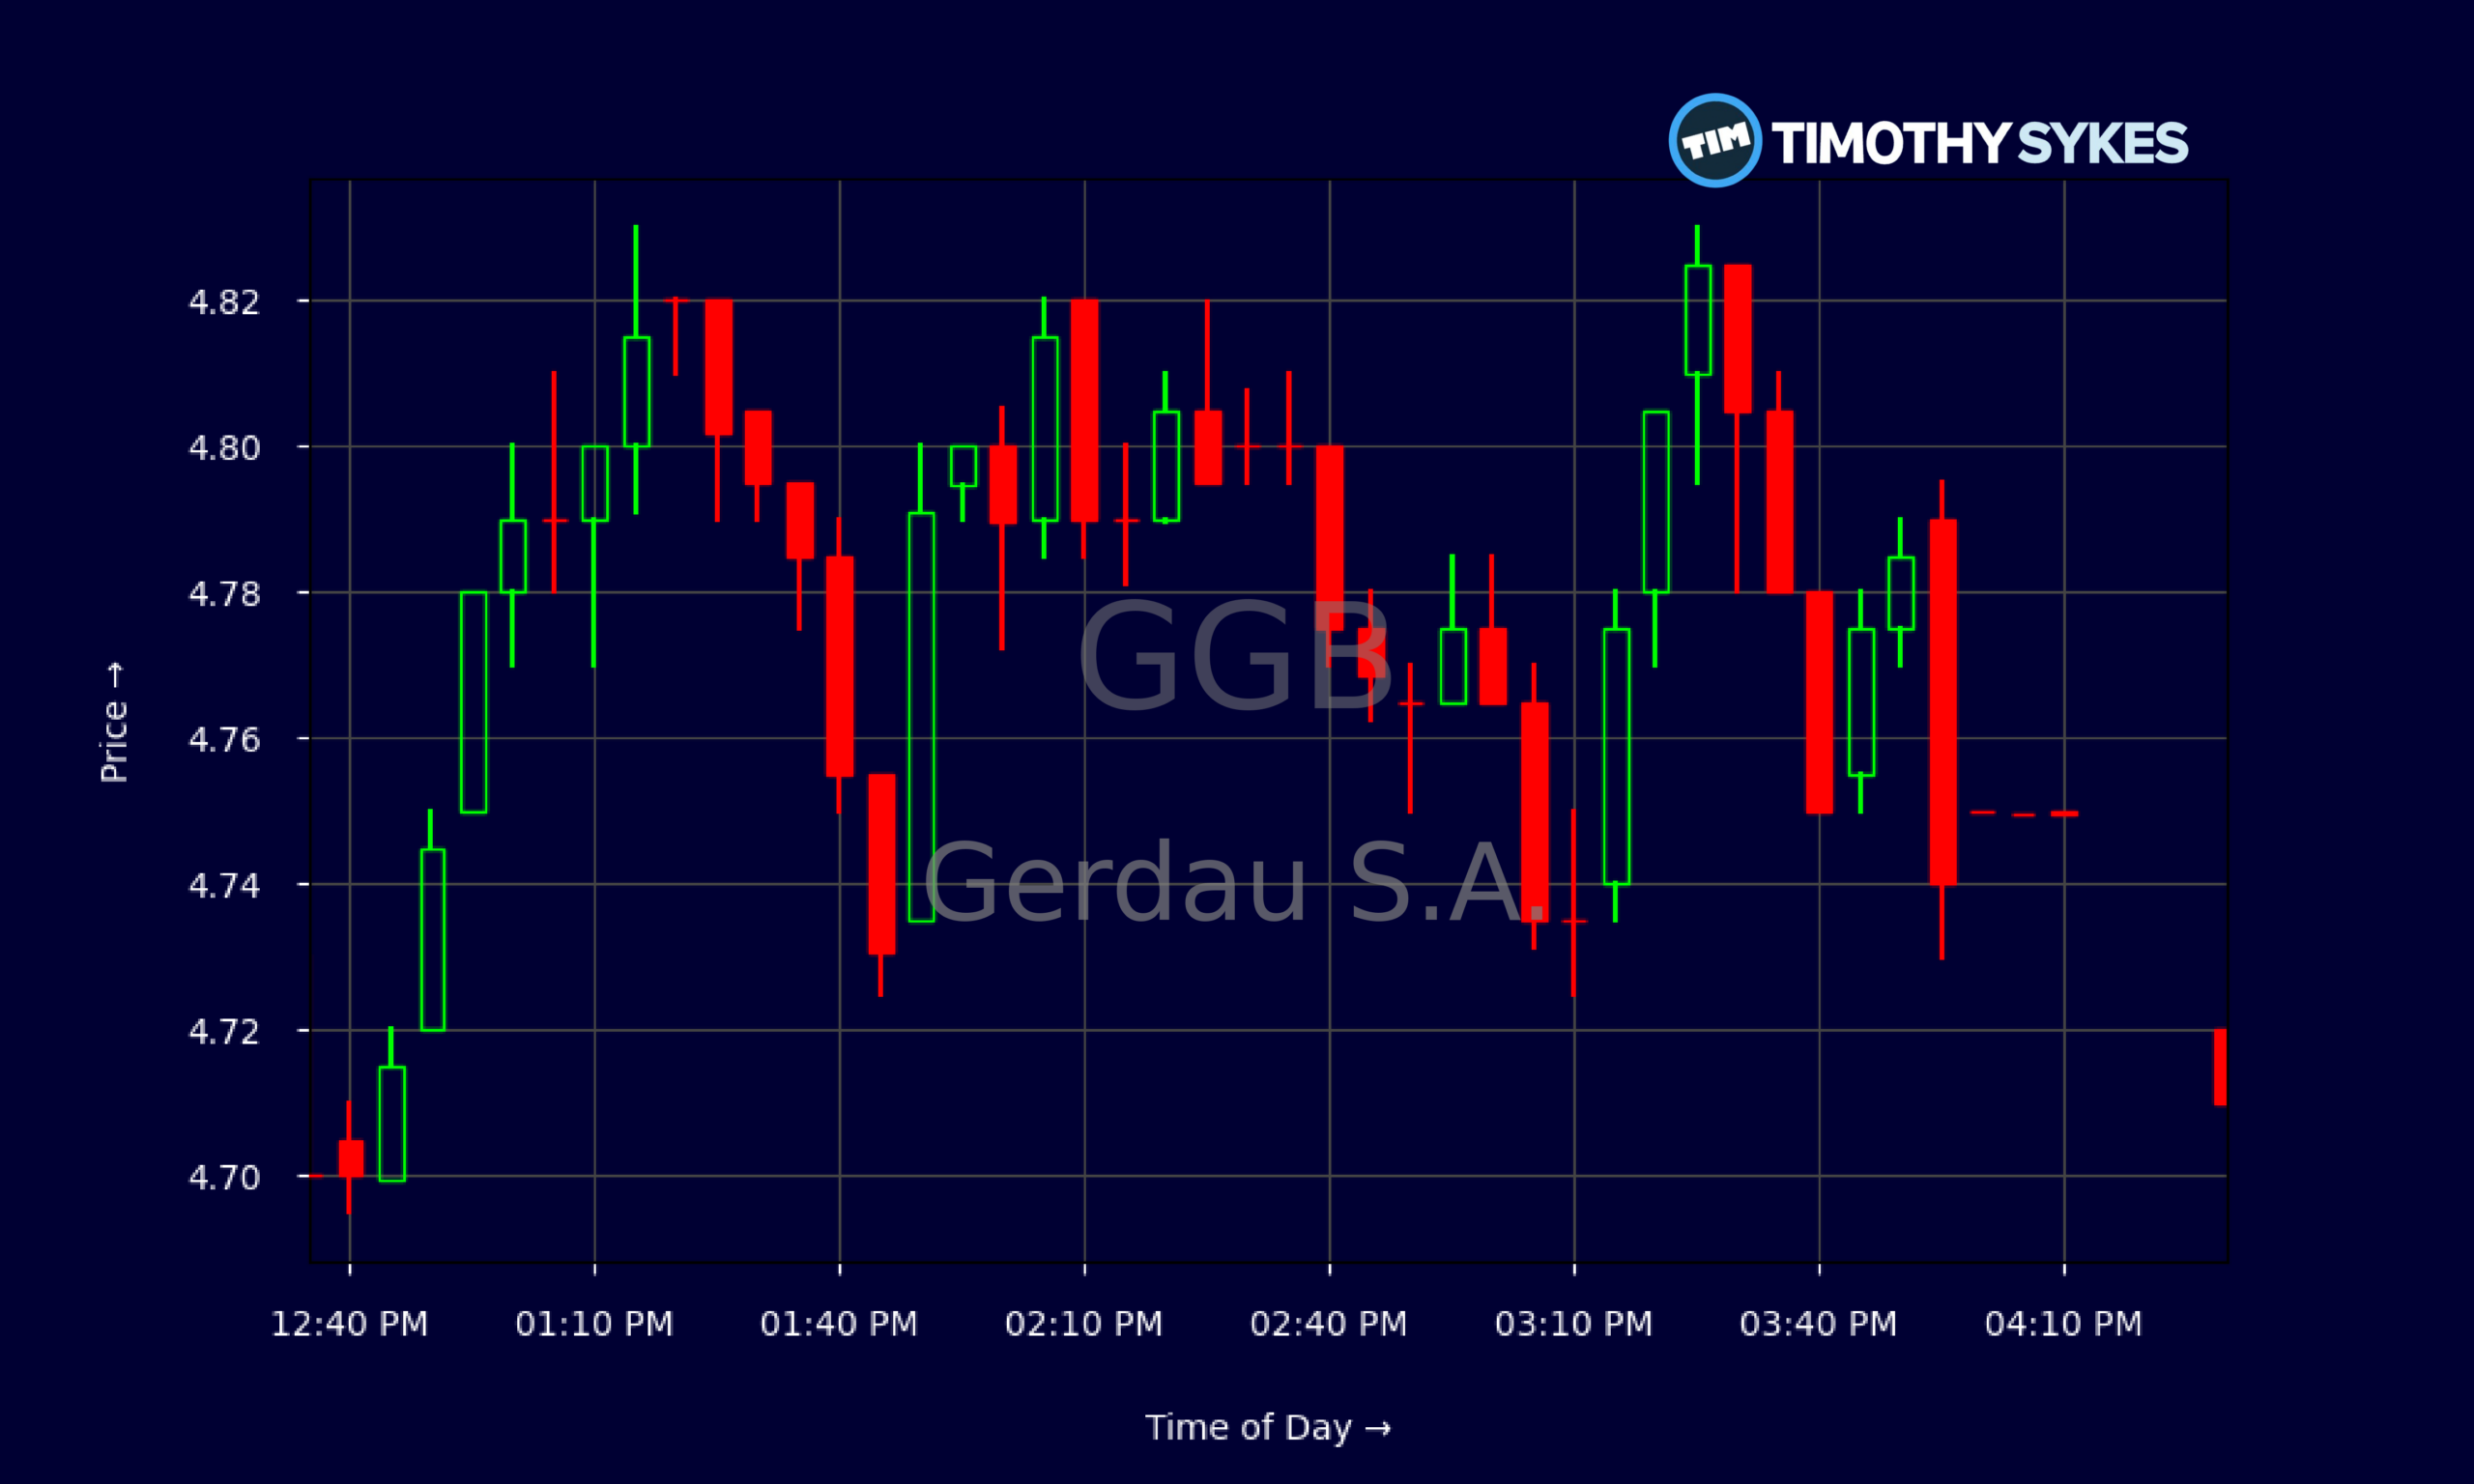
- Recent intraday trading in GGB highlights heavy rotation between $4.70 and $4.80, signaling consolidation after early-morning volatility.
- Gerdau S.A. carries roughly $6.4B in cash and about $13.2B in long-term debt, backed by solid $81.7B in assets.
- Valuation on GGB screens cheap on price-to-sales but rich on earnings, hinting at cyclical pressures in steel pricing.
- Traders in GGB are focused on whether support near $4.70 holds, or if momentum breaks down toward earlier $4.60s levels.
Live Update At 16:46:49 EDT: On Monday, October 26, 2026 Gerdau S.A. stock [NYSE: GGB] is trending down by -8.24%! Discover the key drivers behind this movement as well as our expert analysis in the detailed breakdown below.
Quick Financial Overview
GGB, the U.S.-listed shares of Gerdau S.A., trades like a textbook cyclical name right now. The daily chart shows GGB failing multiple times above $5.20, then rolling over to close near $4.75 in the latest session. That’s a clear lower-high pattern, which tells traders momentum is fading in the short term.
Fundamentally, Gerdau S.A. is still a big player. Revenue sits around $67.0B, but longer-term revenue growth trends are under pressure, which is normal in a steel down-cycle. What jumps out is valuation. GGB trades at roughly 0.74x sales and just under 1.0x book value, which looks “value” on the balance sheet side. At the same time, the reported P/E near 38 is high for a steel name, signaling that current earnings are compressed versus the cycle.
More Breaking News
The balance sheet helps explain why GGB hasn’t totally unraveled. Gerdau S.A. holds about $6.4B in cash and short-term investments against roughly $13.2B in long-term debt and around $0.9B in current debt. Leverage is moderate, and a dividend yield around 3.5% shows GGB continues to return capital, even if payouts have swung with the cycle.
Why Traders Are Watching GGB’s Tight Range
For active traders, GGB is all about the range right now. The intraday 5‑minute chart reads like a training slide: early spike, hard fade, then tight consolidation. GGB opened near $5.02, squeezed to $5.20 in the first 10 minutes, and then sold off into the $4.70s. That opening push in GGB turned into a failed breakout, which often traps late buyers and feeds selling pressure.
From mid-morning onward, GGB turned into a grind. The stock bounced between roughly $4.70 and $4.80, with repeated attempts to push over $4.80 getting slapped back. That tells traders supply is stacked above, probably from short-term players stuck from the $5+ area or from bigger players quietly unloading. By the close, Gerdau S.A.’s U.S. shares settled around $4.75, right in the middle of the intraday range — classic consolidation after volatility.
On the multi-day view, GGB has slipped from closes around $5.24 just sessions ago to sub‑$4.80 now. The downside wicks under $4.60 earlier in the day, and the recent low day close at $4.75, set up $4.70–$4.75 as a must-hold area. If GGB loses that band with volume, traders will watch for a move back toward the early‑month low near $4.70 and even the $4.60s.
At the same time, Gerdau S.A.’s fundamentals and near-1x book valuation can act as an anchor. Many value-oriented traders track GGB for mean-reversion bounces when the chart extends too far from these underlying metrics. So the current tight range is more than noise — it’s a decision point between another leg down and a snapback toward $5.
Conclusion
For traders who like liquid, cyclical names, GGB is setting up as a clear technical battleground. The daily chart on Gerdau S.A. shows a series of lower highs and a recent breakdown from the $5.20s into the $4.70s. Intraday action confirms that story. GGB had a strong open, failed fast, then churned in a narrow band for hours. That’s often what you see before the next directional move.
On the fundamental side, Gerdau S.A. brings a lot to the table: about $81.7B in assets, more than $53.5B in equity, and a manageable liability stack near $27.9B. Profitability metrics — like roughly 18.8% pretax margin and near‑10% return on equity — tell traders the underlying business is still generating real cash, just not at peak-cycle levels. The mix of a low price-to-sales and near‑book valuation against a higher P/E shows how cyclical earnings have been compressed.
For short-term traders, the key is price, not story. GGB needs to reclaim and hold above $4.80–$4.90 to even think about another run at $5.20. If Gerdau S.A. breaks and closes below $4.70 with volume, the path of least resistance shifts lower.
Tim Sykes always says, “Patterns repeat, but you have to be ready.” As millionaire penny stock trader and teacher Tim Sykes says, “Be patient, don’t force trades, and let the perfect setups come to you.” GGB is showing a repeatable pattern right now — failed breakout, consolidation, and a pending decision. Traders studying GGB’s levels, liquidity, and volatility are preparing for whichever way this steel name breaks next. This is educational and research content only, but the chart is giving a clear lesson in how momentum shifts on a cyclical stock.
This is stock news, not investment advice. Timothy Sykes News delivers real-time stock market news focused on key catalysts driving short-term price movements. Our content is tailored for active traders and investors seeking to capitalize on rapid price fluctuations, particularly in volatile sectors like penny stocks. Readers come to us for detailed coverage on earnings reports, mergers, FDA approvals, new contracts, and unusual trading volumes that can trigger significant short-term price action. Some users utilize our news to explain sudden stock movements, while others rely on it for diligent research into potential investment opportunities.
Dive deeper into the world of trading with Timothy Sykes, renowned for his expertise in penny stocks. Explore his top picks and discover the strategies that have propelled him to success with these articles:
- Penny Stocks Trading Guide
- Best Penny Stocks Under $1 to Buy Today
- Top 8 Penny Stocks to Watch on Robinhood
Once you’ve got some stocks on watch, elevate your trading game with StocksToTrade the ultimate platform for traders. With specialized tools for swing and day trading, StocksToTrade will guide you through the market’s twists and turns.
Dig into StocksToTrade’s watchlists here:





Leave a reply