

Eshallgo Inc. stocks have been trading up by 22.54 percent following strong earnings and upbeat forward guidance.
Key Takeaways
- EHGO has pulled back from the $2.90s to around $1.90, giving back a big multi-day spike.
- Eshallgo Inc. shows solid liquidity, with over $5.0M in cash and modest debt, supporting ongoing operations.
- The balance sheet highlights $20.8M in assets and a low price-to-sales ratio near 0.23, drawing value-focused traders.
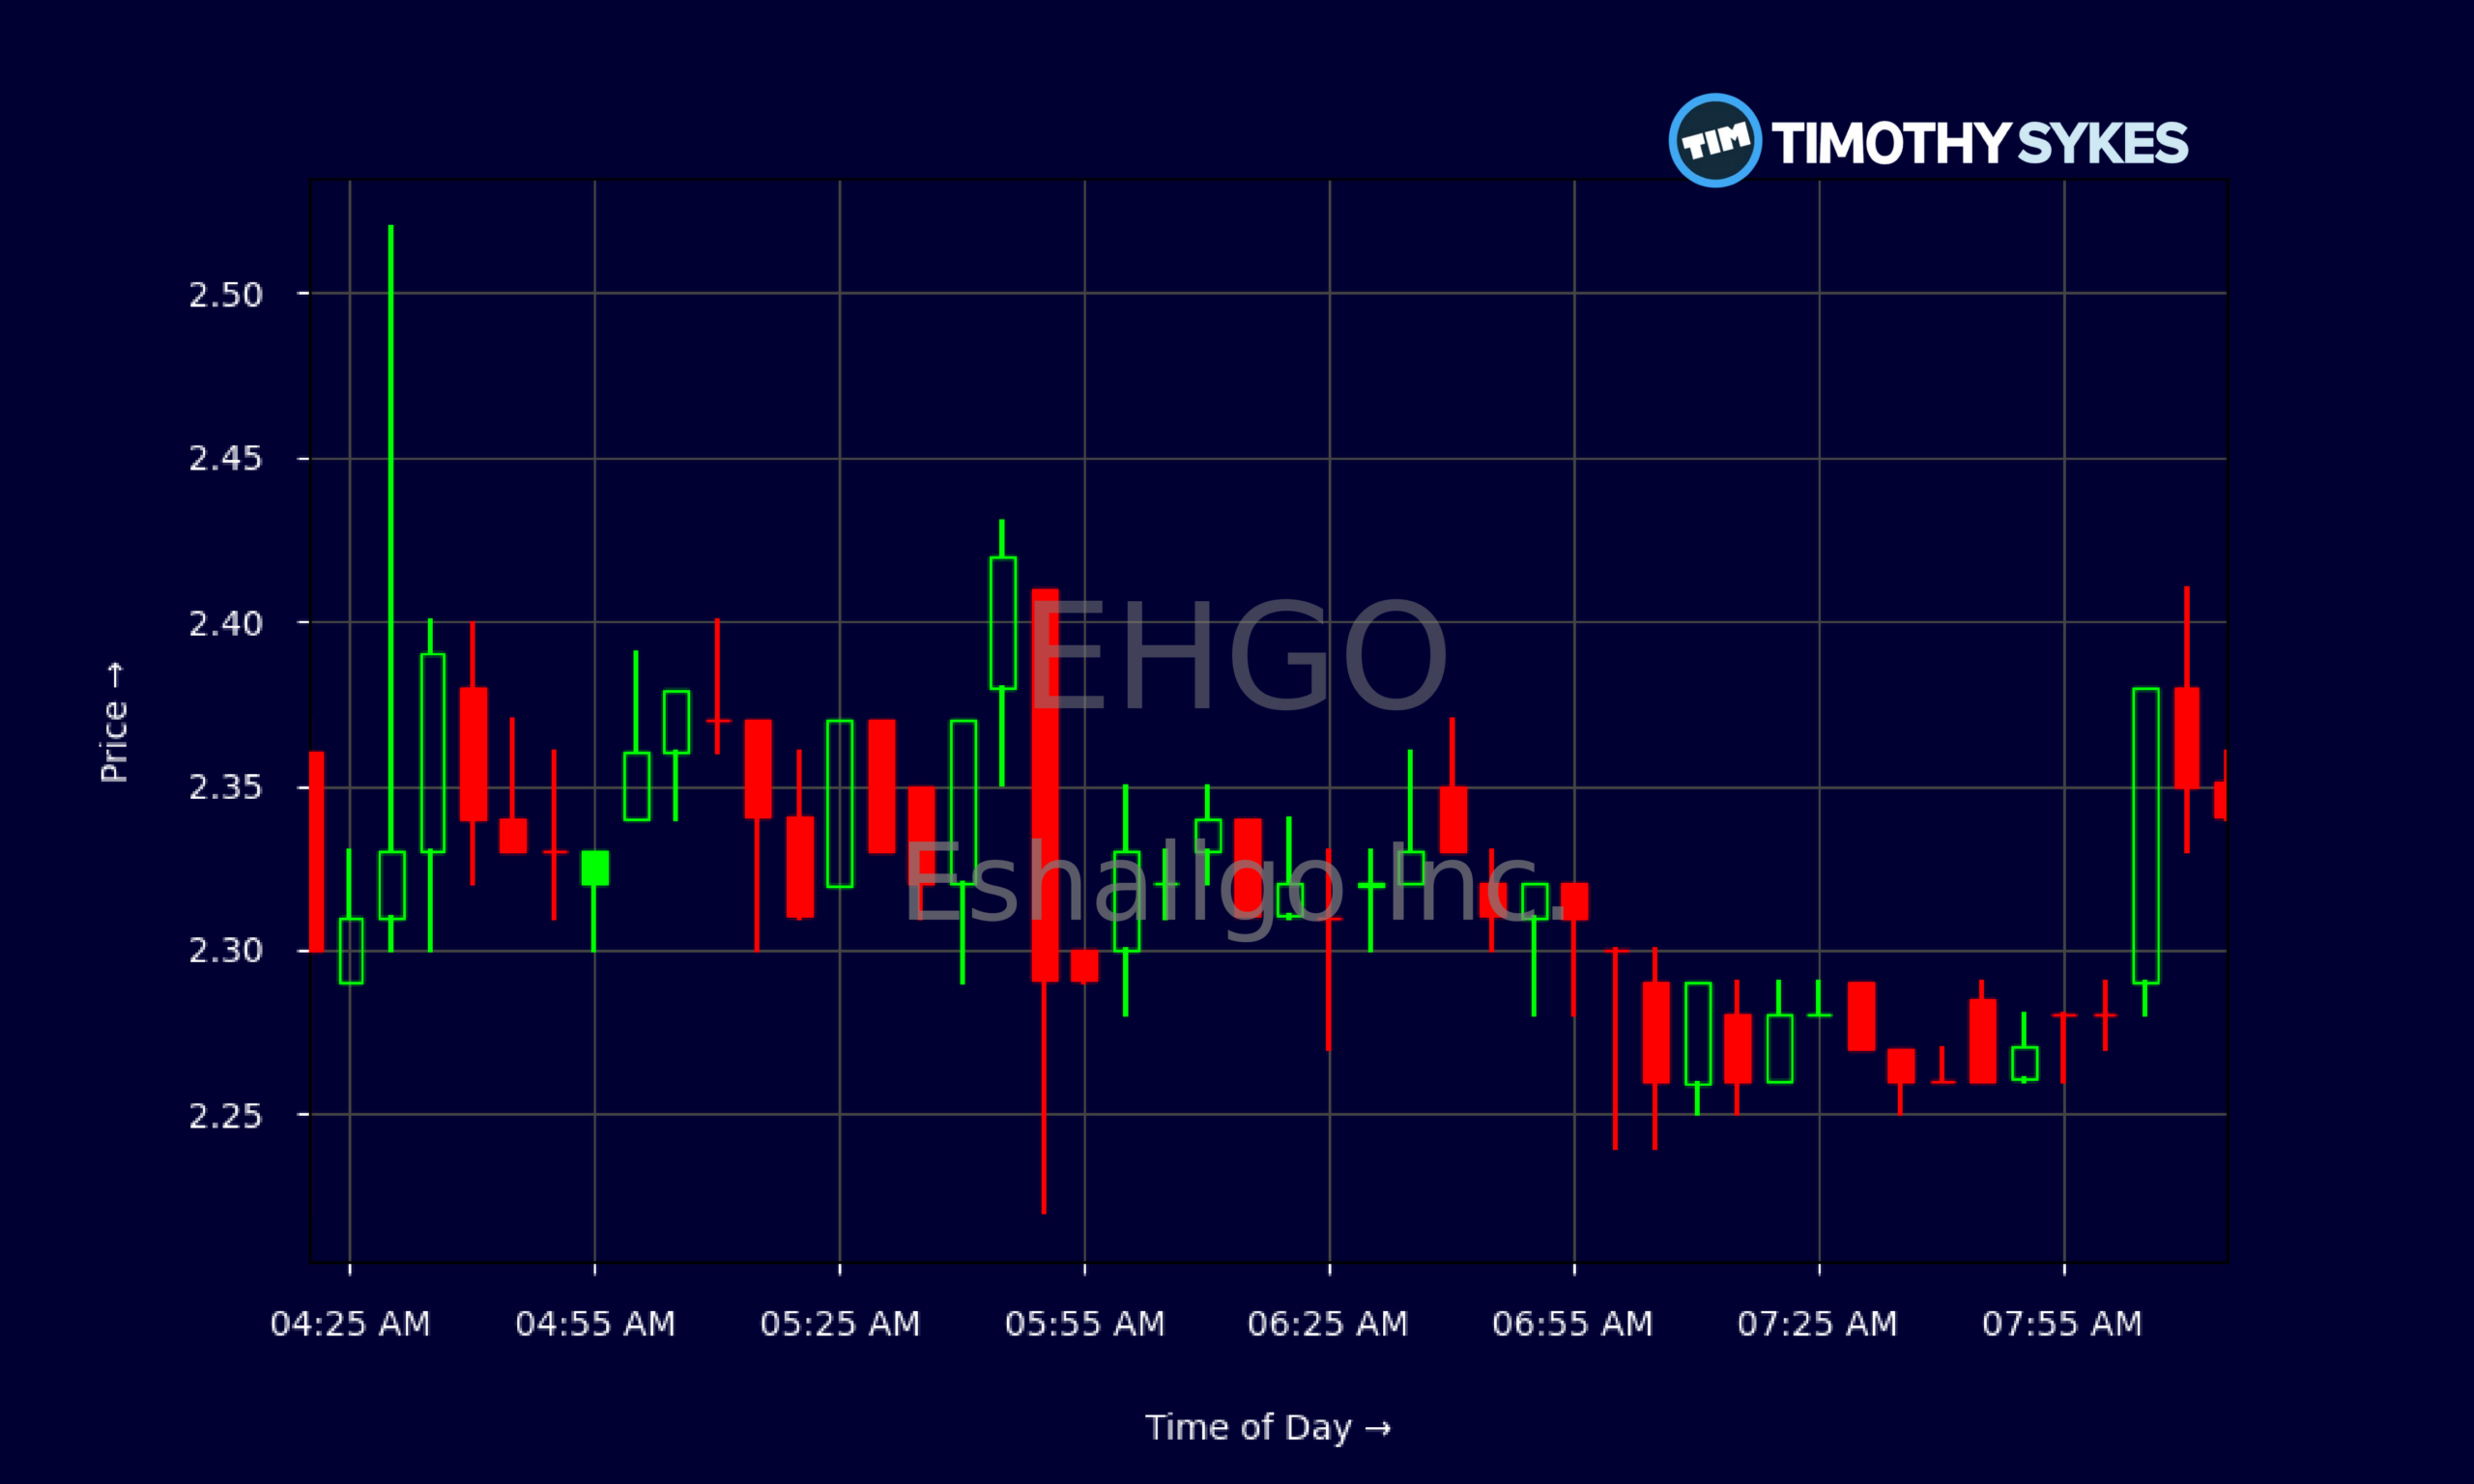
- Intraday EHGO trading shows tight consolidation around $2.30–$2.35, signaling a possible coiled move next.
- Traders are watching support near $1.90 and resistance near $2.50–$2.90 for the next momentum leg.
Live Update At 08:18:52 EST: On Tuesday, November 03, 2026 Eshallgo Inc. stock [NASDAQ: EHGO] is trending up by 22.54%! Discover the key drivers behind this movement as well as our expert analysis in the detailed breakdown below.
Quick Financial Overview
EHGO is trading like a classic low-priced momentum name that just came off a huge run. On the daily chart, Eshallgo Inc. jumped from roughly $0.52 on 2026/10/20 to a high near $3.10 on 2026/10/21, before fading and settling in the low $2s. That’s a massive multi-bagger move in a few days, followed by a sharp pullback to a recent close around $1.91 on 2026/11/02. Traders who chase late get punished in moves like this.
Financially, Eshallgo Inc. is lean but not empty. EHGO posted revenue of about $16.3M, and with a price-to-sales ratio around 0.23, traders are paying relatively little per dollar of sales. Book value per share sits near $1.50, while EHGO trades not far above that, giving it a price-to-book under 0.5 — another value-style signal.
More Breaking News
The balance sheet shows roughly $20.8M in total assets, including about $3.8M in cash and $5.1M in cash plus short-term investments. Total liabilities are about $6.3M, with long-term debt only around $81,000. For an active small-cap like Eshallgo Inc., EHGO carries manageable leverage and decent working capital, which helps keep dilution and survival risk in check for now.
Why Traders Are Watching EHGO’s Price Action
EHGO has the type of chart that grabs day traders right away. In mid-October, Eshallgo Inc. traded quietly under $0.70. Then, on 2026/10/20, the price exploded from around $0.52 to the $0.50s and, by 2026/10/21, EHGO ripped intraday to just over $3.09 before closing in the high $2s. That kind of 4–5x move in two sessions screams momentum, short covering, and aggressive day trading.
What stands out now is the retrace. After topping in the $2.90s, EHGO stepped down through $2.60, $2.50, then $2.20, and now prints near $1.90. Eshallgo Inc. is still well above the original breakout zone, but the late buyers in the $2.70–$3.00 range are underwater. That’s where psychological pressure builds. When price bounces toward those levels, trapped traders often rush to exit, turning that zone into heavy resistance.
Intraday, the 5-minute chart shows EHGO chopping mostly between $2.28 and $2.40, with quick pushes toward $2.50, then snap-backs. That tells traders two things. First, Eshallgo Inc. still has volume and liquidity — it’s not a dead ticker. Second, EHGO is coiling in a relatively tight band after a big rollercoaster move. Consolidation like this often precedes the next decisive push, up or down.
Active traders now frame EHGO with clear levels. Support sits near $1.90–$2.00, where the most recent daily candle closed. Resistance stacks around $2.45–$2.50, then again near the prior high area at $2.90–$3.00. Eshallgo Inc. becomes especially interesting if EHGO breaks one of those zones on strong volume, because momentum traders are always hunting for clean, high-volatility range breaks.
Conclusion
EHGO is a textbook example of why traders need both a chart and a calculator. On the chart side, Eshallgo Inc. ripped from penny territory to nearly $3, then faded but continues to hold well above its prior base. That tells traders EHGO remains in play, even if the easy part of the move is likely over. The recent close around $1.91 lines up as key short-term support. Lose that, and Eshallgo Inc. may drift back toward the $1s. Hold and bounce, and EHGO could retest the $2.50–$2.90 zone where many traders are trapped.
On the fundamentals, the story is surprisingly stable for such a wild price mover. Eshallgo Inc. reports about $16.3M in revenue, $20.8M in assets, and only modest long-term debt. EHGO trades at low price-to-sales and price-to-book ratios, giving value-minded traders a narrative to anchor around while momentum traders focus on volatility.
For educational purposes, the setup is clear: define risk at obvious chart levels, don’t chase, and respect both the upside and downside. As Tim Sykes likes to say, “The market doesn’t owe you anything — protect your downside first, and the upside will take care of itself.” As millionaire penny stock trader and teacher Tim Sykes says, “Preparation plus patience leads to big profits.”. EHGO gives traders a live case study in that mindset — fast moves, clear levels, and a balance sheet that at least gives Eshallgo Inc. some breathing room while the next trend builds.
This is stock news, not investment advice. Timothy Sykes News delivers real-time stock market news focused on key catalysts driving short-term price movements. Our content is tailored for active traders and investors seeking to capitalize on rapid price fluctuations, particularly in volatile sectors like penny stocks. Readers come to us for detailed coverage on earnings reports, mergers, FDA approvals, new contracts, and unusual trading volumes that can trigger significant short-term price action. Some users utilize our news to explain sudden stock movements, while others rely on it for diligent research into potential investment opportunities.
Dive deeper into the world of trading with Timothy Sykes, renowned for his expertise in penny stocks. Explore his top picks and discover the strategies that have propelled him to success with these articles:
- Penny Stocks Trading Guide
- Best Penny Stocks Under $1 to Buy Today
- Top 8 Penny Stocks to Watch on Robinhood
Once you’ve got some stocks on watch, elevate your trading game with StocksToTrade the ultimate platform for traders. With specialized tools for swing and day trading, StocksToTrade will guide you through the market’s twists and turns.
Dig into StocksToTrade’s watchlists here:





Leave a reply