

EOG Resources Inc. stocks have been trading up by 4.23 percent after upbeat shale production and cash-return outlook news.
What Traders Need To Know
- Jefferies lifted its price target on EOG Resources to $185 and expects Q3 cash flow per share to beat consensus by 13% on stronger production and cost improvements into 2027.
- Mizuho and BMO raised targets to $165 and $170 with Outperform views, reinforcing broad bullish expectations for EOG.
- UBS pushed its target to $186 while the Street’s mean target sits in the mid-$160s, above current trading levels.
- Morgan Stanley raised its target to $163 and flagged 2027 plans and Q3 commentary with oil near $100 as key focus points.
- Scotiabank’s neutral $144 target highlights that some see more limited upside despite the overall overweight consensus.
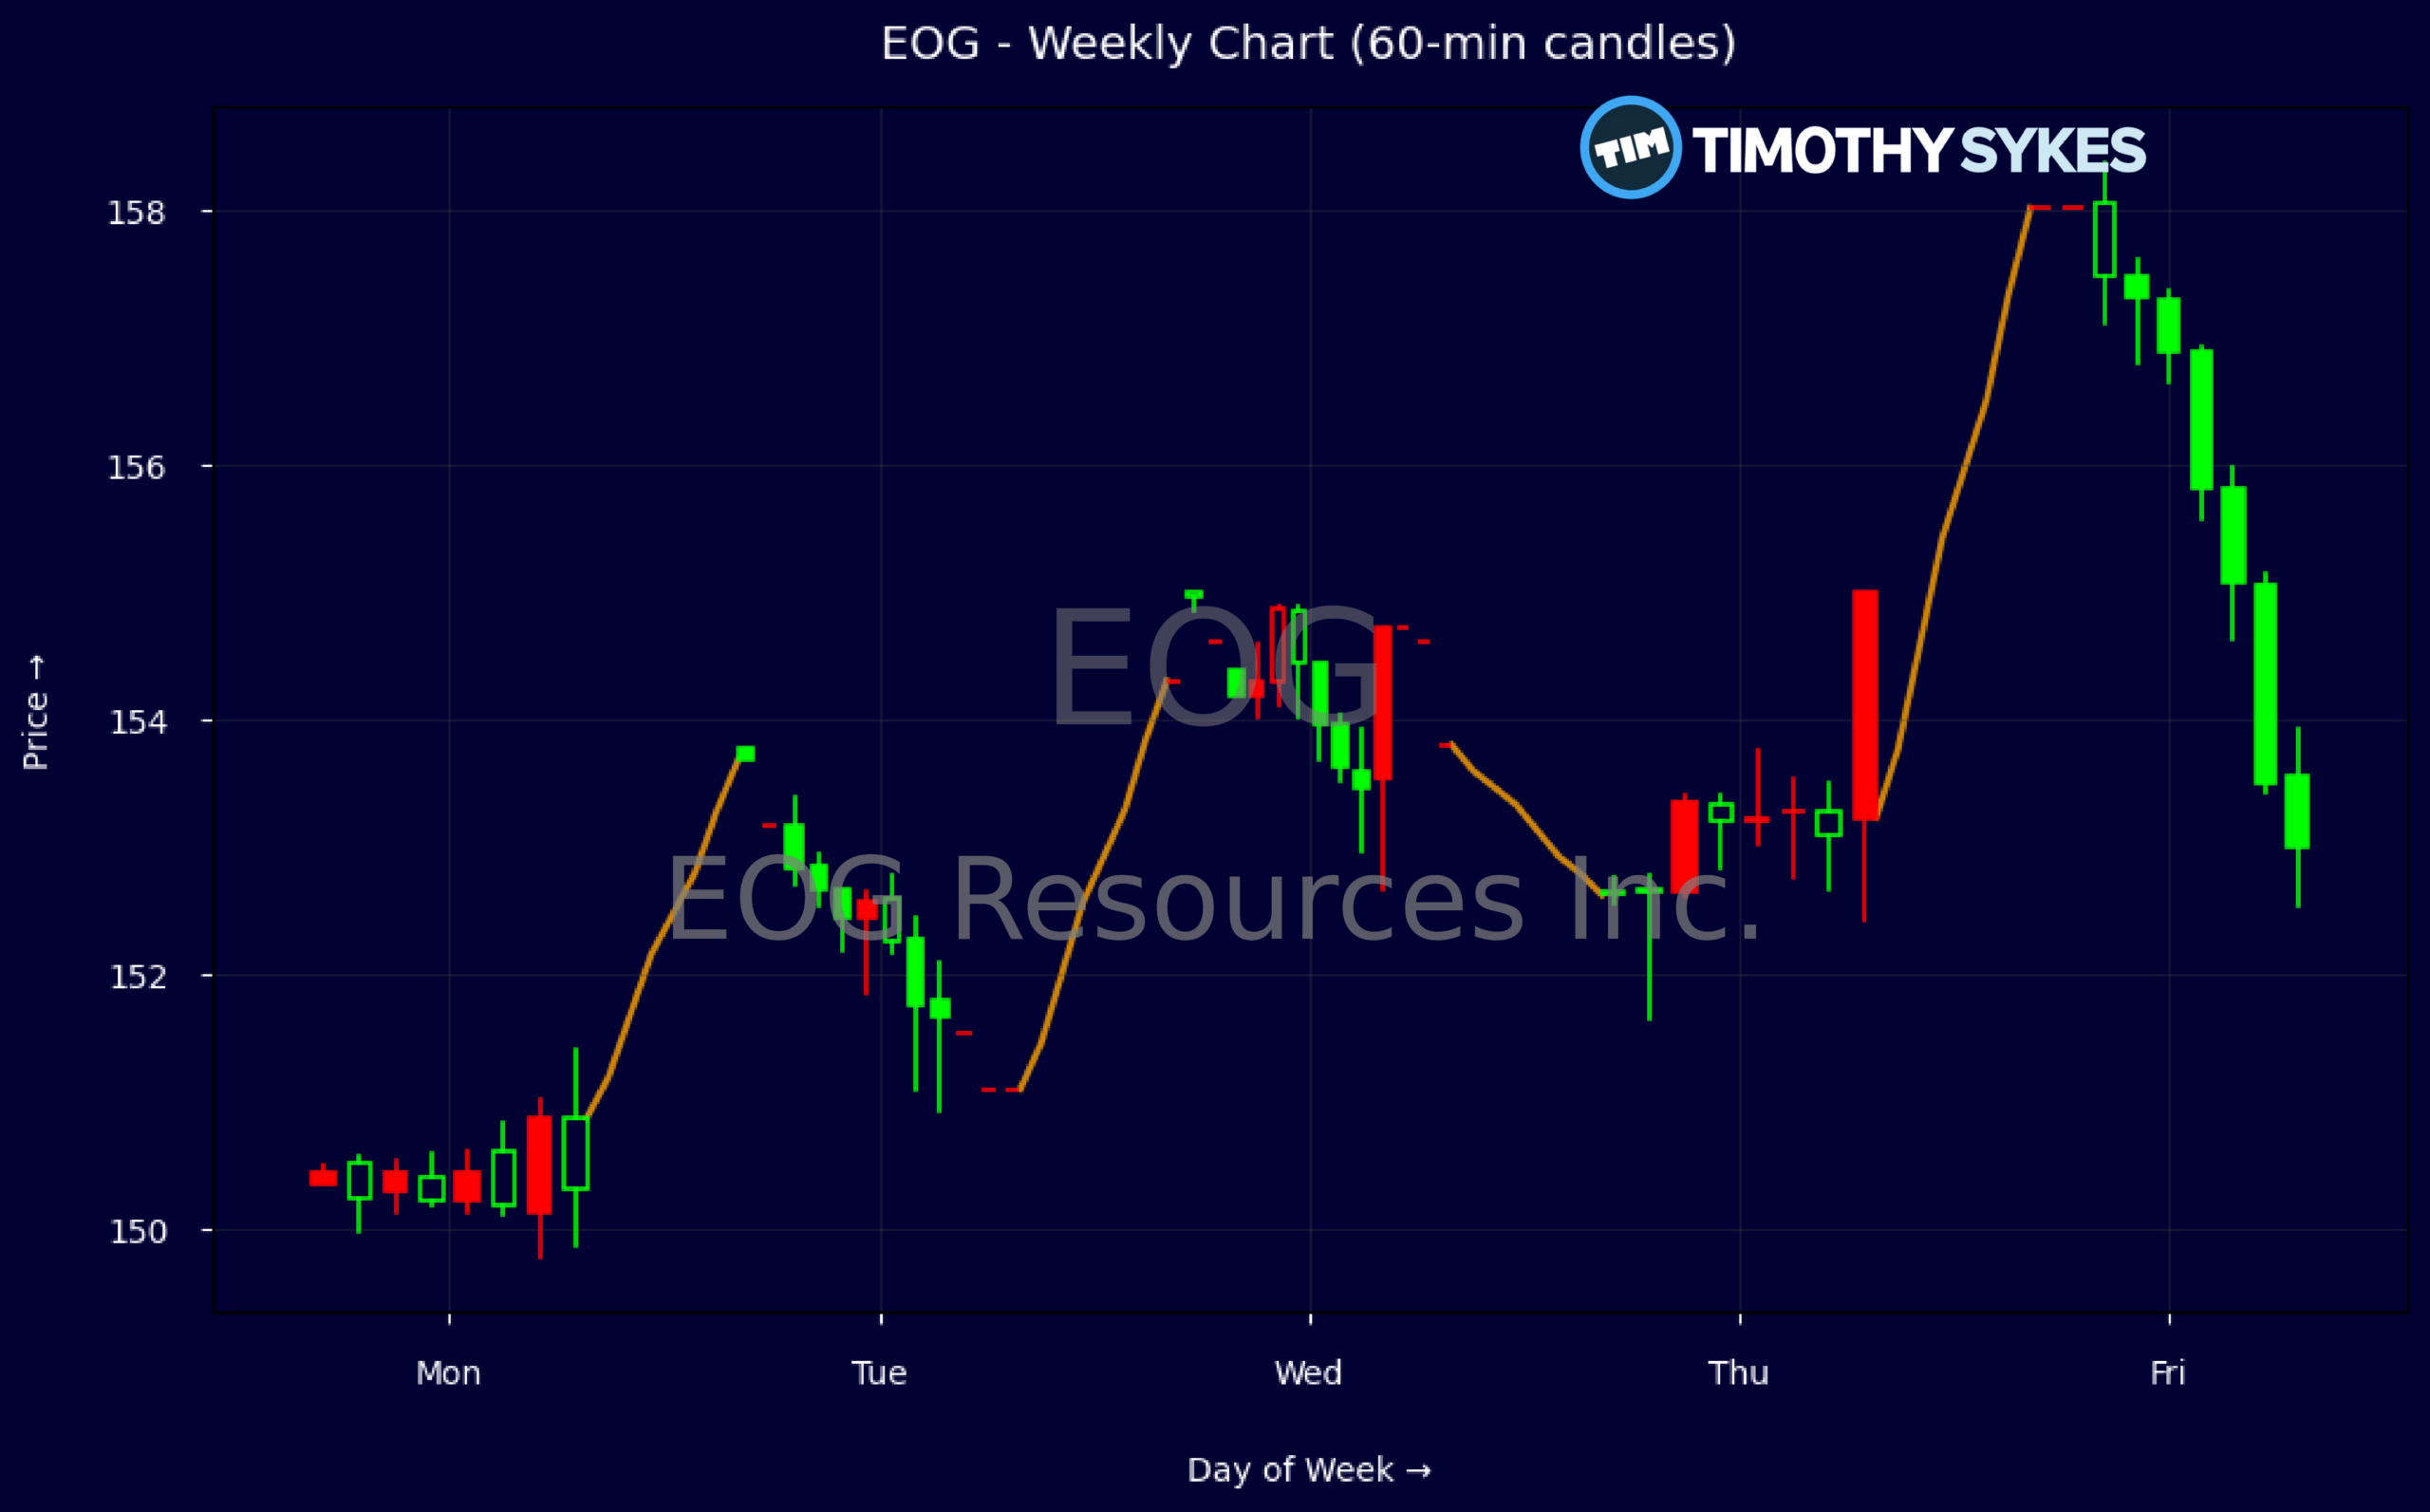
Weekly Update Oct 12 – Oct 16, 2026: On Friday, October 16, 2026 EOG Resources Inc. stock [NYSE: EOG] is trending up by 4.23%! Discover the key drivers behind this movement as well as our expert analysis in the detailed breakdown below.
Energy industry expert:
Analyst sentiment – positive
EOG sits in the top tier of North American E&Ps, combining scale with best‑in‑class returns. EBIT margin of 27% and EBITDA margin above 45% on $22.6B of revenue underscore strong cost discipline, while ROE of ~23–25% and ROIC >14% comfortably exceed most oil and gas peers. The balance sheet is conservative (debt/equity 0.26x, current ratio 1.9x), supporting a 2.7% dividend yield plus active buybacks, funded by $4.7B operating cash flow and $2.9B quarterly FCF.
Weekly price action shows a strong, accelerating uptrend: shares moved from ~$150 to $158, with successive higher highs and no meaningful downside follow‑through on brief intraday pullbacks. Five‑minute tape indicates aggressive dip‑buying around $152–153 with rising volume into the $155–157 zone, confirming institutional accumulation. Dominant trend is bullish. Actionable level: $152 is key support; tactical long entries $153–155 with stops just below $150, targeting a retest and extension through the recent $158 high.
Street sentiment is firmly positive, with multiple Buy/Outperform ratings and targets clustered in the $160–185 range, versus current ~$158 and sector averages implying lower growth and returns. With oil near $100 and EOG’s superior capital efficiency, it should outperform Energy and Fossil Fuels benchmarks into 2027 as cash flow beats and 2027 plans are detailed. I set a 12‑month target of $175, with support at $150 and resistance initially at $165, then $180.
More Breaking News
Quick Financial Overview
EOG Resources Inc. is trading around the mid‑$150s after a steady grind higher in recent days, with the weekly data showing a push from near $150 to a close at $158.01. That climb lines up with a flurry of target hikes into Q3 earnings, as the Street’s mean target in the mid‑$160s signals upside from current levels. For short‑term traders, this is a classic pre‑earnings buildup: price stair‑steps higher, analysts turn more positive, and expectations get loaded into the chart.
Intraday, EOG has been trending firm but controlled. The 5‑minute tape shows a series of higher lows from the low‑$153s at the open up toward $158 into the close, with tight intraday ranges and no heavy flushes. That is constructive action: dips are shallow, and supply gets absorbed quickly. It also means any break below the prior intraday base near $156‑$157 would be your first real sign that momentum money is backing off.
Fundamentally, EOG Resources Inc. is printing strong numbers. Revenue runs around $22.58B with fat 74.7% gross margin and a profit margin above 25%, while EBITDA margin north of 45% underpins solid cash generation. A P/E near 11.5 and price‑to‑cash‑flow around 4.2, paired with low leverage (debt‑to‑equity about 0.26) and interest coverage over 45, give the name room to handle commodity swings. Q2 free cash flow of roughly $2.89B against $4.67B in operating cash flow and a dividend yield near 2.7% show why analysts are comfortable raising targets, especially with Jefferies expecting a double‑digit cash‑flow beat.
Conclusion
EOG Resources Inc. sits at an interesting point on the curve: the stock has already moved from about $150 to $158 this week, yet the Street’s average target in the mid‑$160s, with UBS out at $186 and Jefferies at $185, still implies further upside. The bullish case leans on strong profitability, big free cash flow, and tight cost control, all backed by a clean balance sheet and steady return of capital. For traders, that backdrop means dips into prior support zones can attract buyers, especially if Q3 numbers confirm the 13% cash‑flow beat Jefferies is modeling. As millionaire penny stock trader and teacher Tim Sykes says, “Consistency is key in trading; don’t let emotions dictate your trades.” In that context, EOG’s setup rewards those who stick to predefined levels and rules rather than chasing headlines or trying to outguess every tick.
The risk is that expectations are now elevated. Scotiabank’s $144 Sector Perform target and Hold‑rated calls from names like Truist and Morgan Stanley show that not everyone is chasing the upside, and that Q3 commentary on 2027 plans, capital spend, and well productivity will be judged sharply. If oil backs off $100 or guidance underwhelms, the recent grind higher in EOG could quickly unwind toward the mid‑$140s where more cautious targets sit. For educational purposes, traders should treat EOG Resources Inc. as a catalyst‑driven setup: watch the $156‑$157 intraday band as near‑term support and the mid‑$160s as the first big target zone. As I tell my own students, “When the Street crowds to one side of the boat, you trade the reaction, not the headlines — let the post‑earnings tape show you if EOG has real follow‑through or just priced‑in hope.”
This is stock news, not investment advice. Timothy Sykes News delivers real-time stock market news focused on key catalysts driving short-term price movements. Our content is tailored for active traders and investors seeking to capitalize on rapid price fluctuations, particularly in volatile sectors like penny stocks. Readers come to us for detailed coverage on earnings reports, mergers, FDA approvals, new contracts, and unusual trading volumes that can trigger significant short-term price action. Some users utilize our news to explain sudden stock movements, while others rely on it for diligent research into potential investment opportunities.
Dive deeper into the world of trading with Timothy Sykes, renowned for his expertise in penny stocks. Explore his top picks and discover the strategies that have propelled him to success with these articles:
- Penny Stocks Trading Guide
- Best Penny Stocks Under $1 to Buy Today
- Top 8 Penny Stocks to Watch on Robinhood
Once you’ve got some stocks on watch, elevate your trading game with StocksToTrade the ultimate platform for traders. With specialized tools for swing and day trading, StocksToTrade will guide you through the market’s twists and turns.
Dig into StocksToTrade’s watchlists here:





Leave a reply