

Exascale Labs Holdings Inc. stocks have been trading up by 35.29 percent after transformative AI partnership news boosted investor optimism.
Key Takeaways
- Shares of XLAB have sold off sharply from the $2.90s to near $1.30, signaling a broken short-term uptrend that active traders are watching closely.
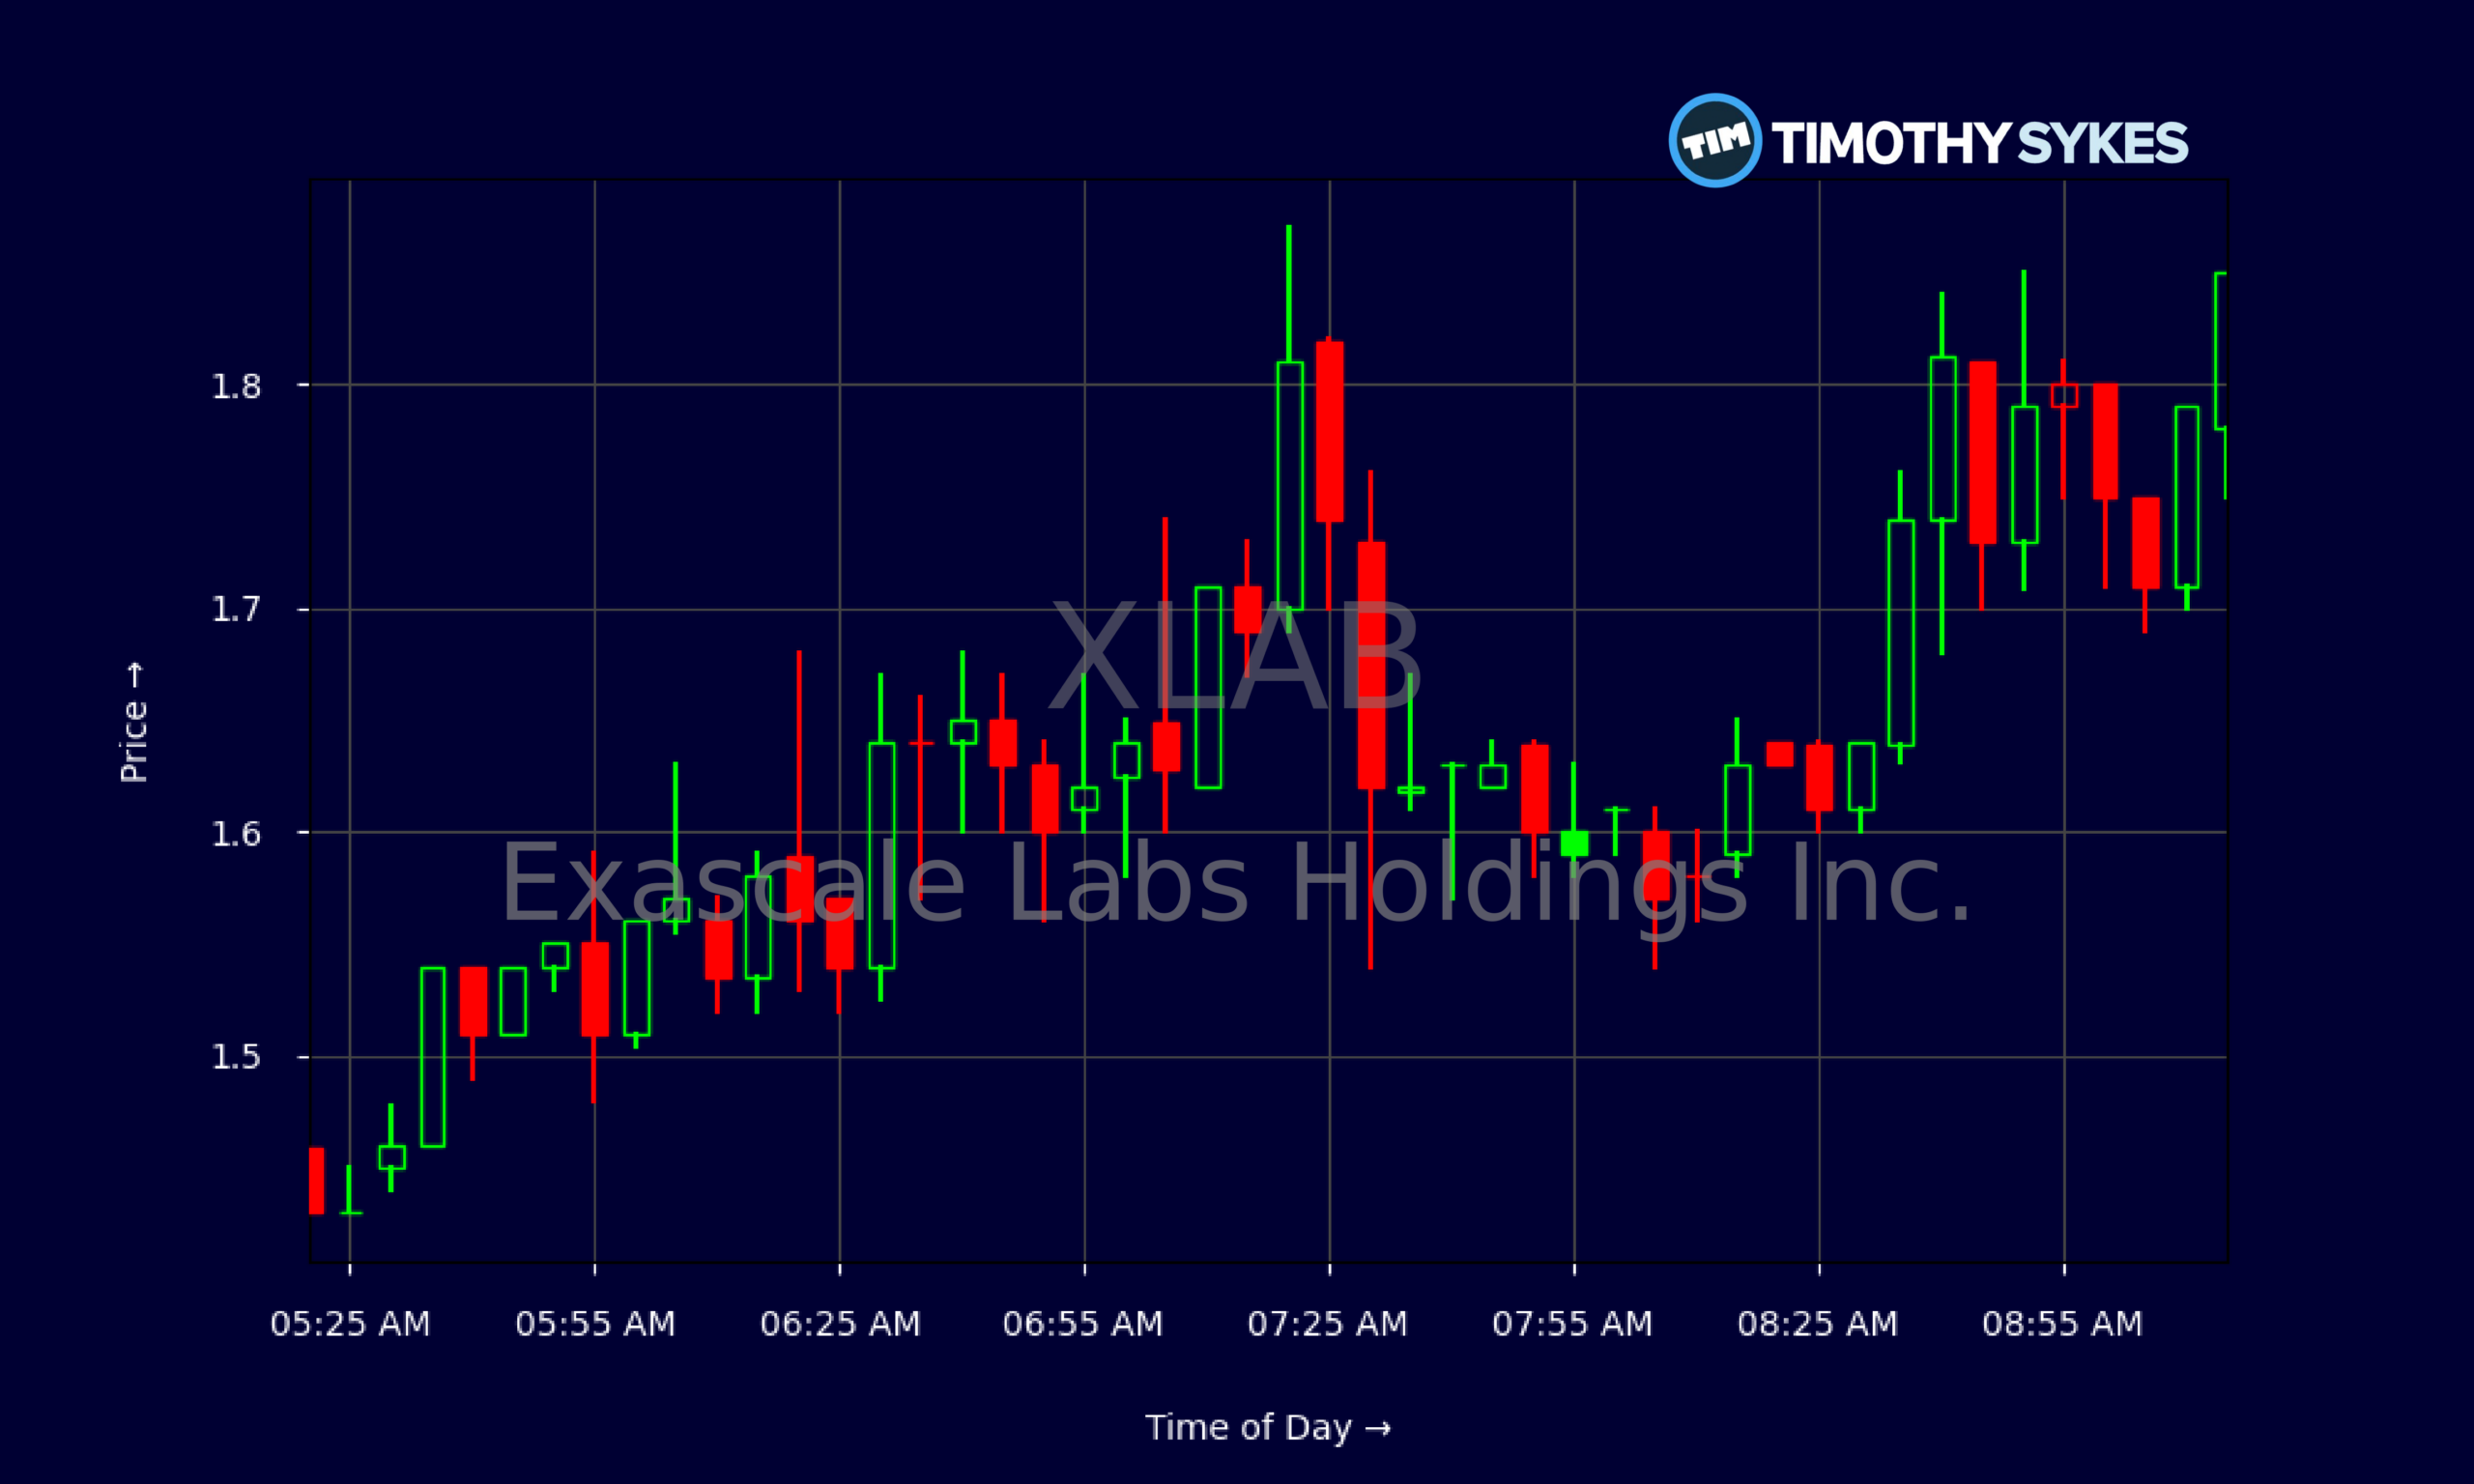
- Intraday XLAB action shows heavy whipsaws between $1.40 and $1.85, highlighting elevated volatility and fast-changing order flow.
- Exascale Labs Holdings Inc. posts roughly $7.0M in revenue but carries negative equity and steeply negative returns on assets, a red flag for longer-term stability.
- XLAB relies on fresh capital raises, with recent cash gains driven by stock issuance rather than strong operating profits.
Live Update At 09:18:38 EDT: On Friday, October 16, 2026 Exascale Labs Holdings Inc. stock [NASDAQ: XLAB] is trending up by 35.29%! Discover the key drivers behind this movement as well as our expert analysis in the detailed breakdown below.
Quick Financial Overview
Exascale Labs Holdings Inc., trading under the ticker XLAB, is a classic small-cap volatility story with shaky fundamentals underneath. The company generated about $7.0M in revenue over the last reported period, which sounds decent at first glance. But once you dig into the ratios, the picture changes fast.
XLAB shows a pretax profit margin around -70.1%. That means for every $1 in sales, Exascale Labs is losing about $0.70 before taxes. Return on assets near -36% underlines how inefficiently the business is using what it owns. Traders who track balance sheets will also notice the negative book value: XLAB’s book value per share is about -$0.20, and price-to-book runs near -4.8. That negative equity — roughly -$13.0M — is a major warning sign.
More Breaking News
On the cash-flow side, Exascale Labs Holdings Inc. looks better on the surface. Operating cash flow sits near $2.7M and free cash flow is positive, but a big piece of that strength is tied to working-capital swings and stock-based financing. XLAB boosted cash from roughly $0.7M to more than $7.2M mainly through about $4.3M in new stock issuance. For traders, that says dilution risk is real, and the company remains heavily dependent on external funding to stay in the game.
Why Traders Are Watching XLAB’s Price Swings
XLAB’s chart is doing exactly what short-term traders like: big moves, tight ranges, and clear levels. But underneath that action, Exascale Labs Holdings Inc. shows the kind of financial strain that can fuel both high-flyer rallies and brutal dumps.
Look at the daily chart first. In late September, XLAB traded near $2.90 and pushed through $3.00 intraday. Since then, the stock has trended lower almost every session, closing recently around $1.36. That’s more than a 50% slide in a few weeks. Each bounce — like the push from $0.86 to $1.45 on the latest day before closing at $1.36 — has been sold into. That pattern screams “overhead supply,” where trapped longs are using any spike to exit.
Intraday, the 5‑minute chart confirms the tug-of-war. Early premarket action saw XLAB bouncing between $1.45 and $1.60, then powering as high as $1.87 before fading. The tape shows repeated pushes into the mid‑$1.80s followed by lower lows back toward $1.40–$1.50. For active trading, that creates short-term breakout and fade setups, but it also warns that Exascale Labs Holdings Inc. lacks steady buying support.
The valuation adds more fuel. With an enterprise value near $54.2M on about $7.0M in revenue, XLAB trades at roughly 16.7x sales. That’s a high bar for a company with negative margins and negative equity. Many momentum traders lean into that kind of disconnect: if sentiment flips, the squeeze can be violent; if reality catches up, the drop accelerates. Either way, Exascale Labs Holdings Inc. is on radar screens precisely because the fundamentals and the chart are pulling in opposite directions.
Conclusion
For disciplined traders, XLAB is a textbook example of why you always marry the chart with the numbers. Exascale Labs Holdings Inc. offers plenty of volatility, both intraday and on the multi‑day chart. Sharp runs from the $1.40s into the $1.80s show that XLAB can move fast when volume hits. But the bigger trend — a fall from the high-$2.00s and $3.00 zone down toward $1.00–$1.40 — says any long bias needs strict risk control.
Fundamentally, Exascale Labs Holdings Inc. is still in the danger zone. Negative margins, heavy losses on assets, and a deeply negative equity balance tell traders this is not a stable, slow-and-steady story. Positive free cash flow helps, but much of XLAB’s runway comes from selling stock, not from strong, repeatable profits.
That’s exactly the kind of setup where rules matter more than opinions. As Tim Sykes loves to say, “The market doesn’t care about your opinion, it cares about your discipline.” As millionaire penny stock trader and teacher Tim Sykes, says, “There is always another play around the corner; don’t chase just because you feel FOMO.”. With XLAB, discipline means treating every trade as a trade — not a marriage. Watch key levels, like recent support near $0.85–$0.90 and resistance around $1.80–$2.00. Let the Exascale Labs Holdings Inc. price action prove itself, cut losses fast if it doesn’t, and remember this is educational and research material only, never a signal to buy or sell.
This is stock news, not investment advice. Timothy Sykes News delivers real-time stock market news focused on key catalysts driving short-term price movements. Our content is tailored for active traders and investors seeking to capitalize on rapid price fluctuations, particularly in volatile sectors like penny stocks. Readers come to us for detailed coverage on earnings reports, mergers, FDA approvals, new contracts, and unusual trading volumes that can trigger significant short-term price action. Some users utilize our news to explain sudden stock movements, while others rely on it for diligent research into potential investment opportunities.
Dive deeper into the world of trading with Timothy Sykes, renowned for his expertise in penny stocks. Explore his top picks and discover the strategies that have propelled him to success with these articles:
- Penny Stocks Trading Guide
- Best Penny Stocks Under $1 to Buy Today
- Top 8 Penny Stocks to Watch on Robinhood
Once you’ve got some stocks on watch, elevate your trading game with StocksToTrade the ultimate platform for traders. With specialized tools for swing and day trading, StocksToTrade will guide you through the market’s twists and turns.
Dig into StocksToTrade’s watchlists here:




Leave a reply