

Click Holdings Limited faces mounting investor concern after regulatory probes, with stocks have been trading down by -12.4 percent.
Key Takeaways
- CLIK has swung between $1.06 and $1.65 this month, with a sharp intraday spike giving way to a hard fade.
- The latest CLIK close near $1.13 sits well below the morning high, signaling profit-taking and weak intraday follow-through.
- Click Holdings Limited shows roughly $10.6M in cash and modest debt, giving traders a cushion-focused balance sheet story rather than a growth one.
- With price near 0.11x sales and 0.09x book, CLIK trades like a deep-value microcap where sentiment and liquidity drive short-term moves.
Live Update At 12:33:10 EDT: On Friday, October 23, 2026 Click Holdings Limited stock [NASDAQ: CLIK] is trending down by -12.4%! Discover the key drivers behind this movement as well as our expert analysis in the detailed breakdown below.
Quick Financial Overview
CLIK is trading like a classic thin microcap: cheap on paper, choppy on the screen. Over the past few weeks, Click Holdings Limited has mostly chopped between $1.06 and $1.17, with brief pushes into the mid-$1.20s and a one-off blast toward $1.65 that quickly reversed. That kind of wick tells traders there is interest, but not yet strong conviction.
On the fundamentals, CLIK reports about $83.5M in revenue and a book value per share near $11.87. With the stock around the low $1s, the market prices Click Holdings Limited at roughly 0.11x sales and 0.09x book. Those are “something is discounted here” levels. Either the business is challenged, or the market is ignoring it.
More Breaking News
The balance sheet for CLIK looks surprisingly sturdy for a microcap. Total assets run around $141.4M with equity just over $101.6M, and only about $3.98M in long-term debt plus $1.88M in current lease obligations. Cash of about $10.6M and working capital above $21M give Click Holdings Limited some breathing room, which matters when liquidity in the stock is erratic and sentiment-driven.
Why Traders Are Watching CLIK’s Volatile Tape
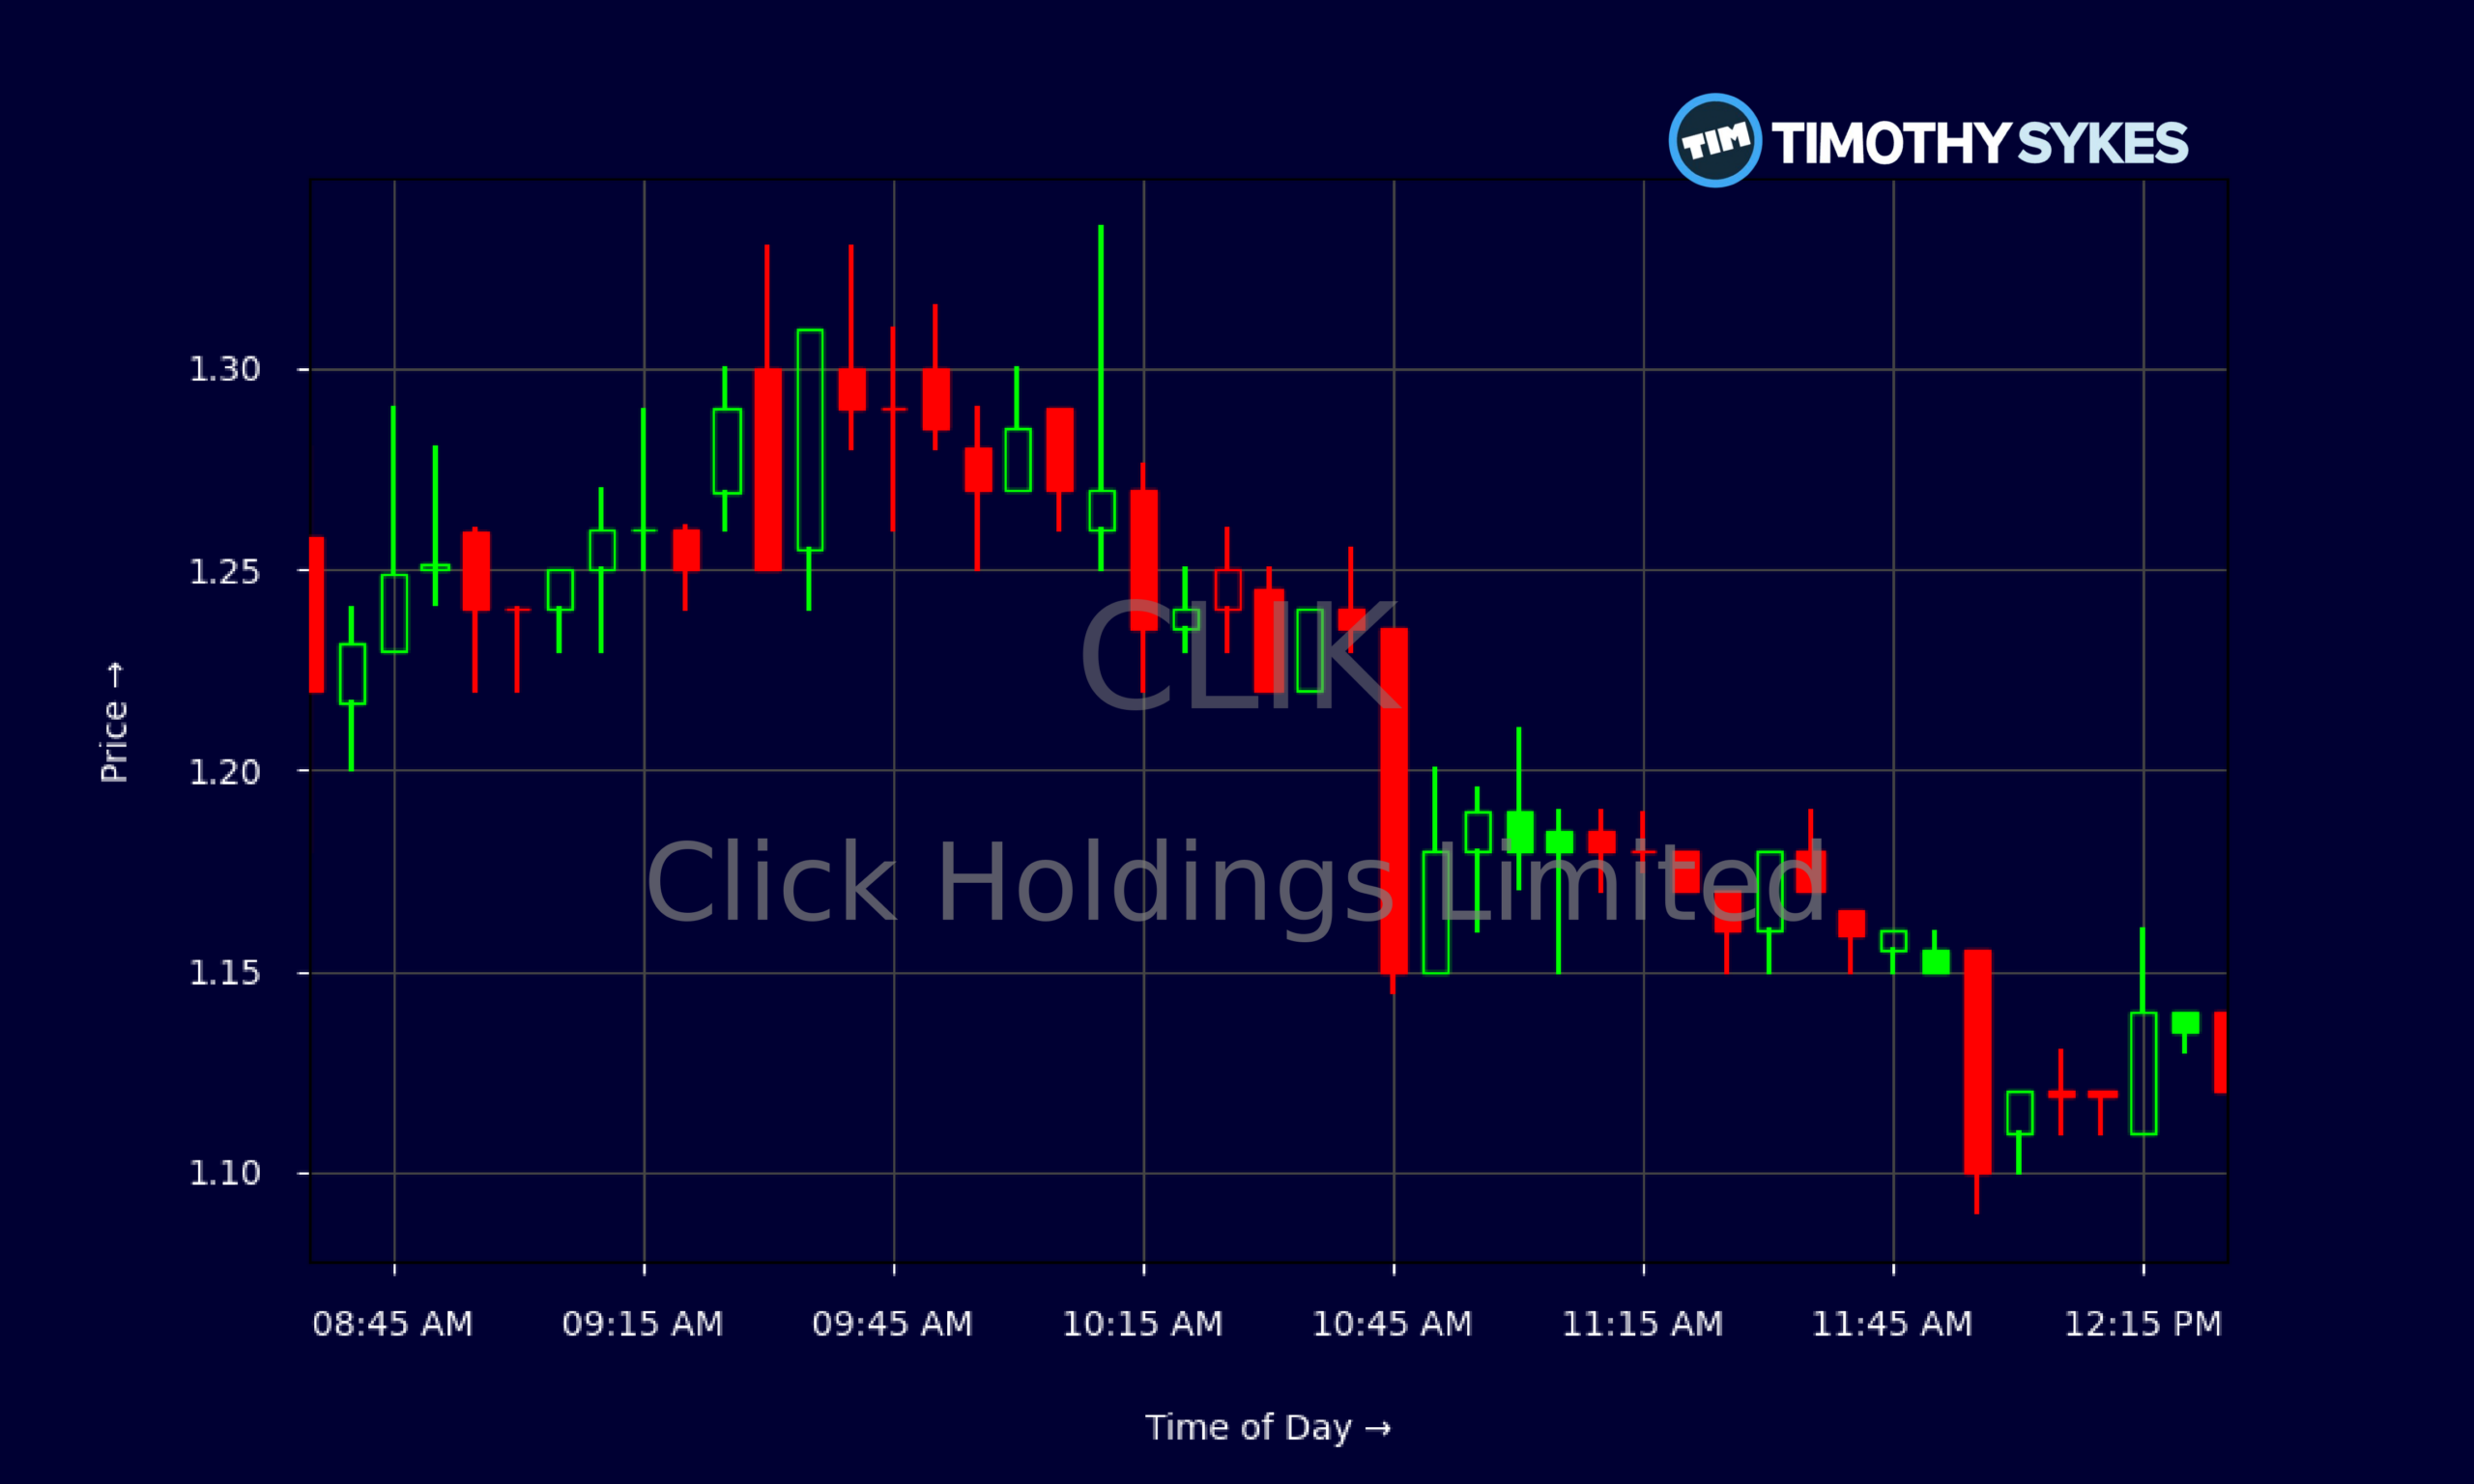
Traders are glued to the CLIK chart because it has the exact ingredients momentum players hunt: low price, tight float feel, and sudden air pockets of volatility. On the latest trading day, Click Holdings Limited opened around $1.30, spiked to roughly $1.335 in the morning rush, then dumped to about $1.09 before staggering back to close near $1.13. That’s a wide intraday range for a $1 stock.
Look closer at the 5-minute tape. Pre-market, CLIK squeezed from the low $1.30s up toward $1.65, then knifed down to the $1.20s even before the open. At the bell, Click Holdings Limited briefly held the $1.30 area, but by late morning the stock slid into the $1.15–$1.20 zone, then cracked $1.10. This is classic “gap-and-fade” action that punishes late chasers.
For day traders, CLIK’s pattern is straightforward: early spikes into liquidity, followed by heavy selling and consolidation at lower levels. Support has repeatedly shown up near $1.06–$1.09 on the daily chart, while the mid-$1.20s to low-$1.30s now act as a supply zone. Each time Click Holdings Limited pushes into that band, sellers step in and dump size.
That tug-of-war creates opportunity for nimble traders who respect risk. CLIK does not yet show a clean, sustained uptrend; it shows fast moves that reward those who take singles and cut losses fast. Until Click Holdings Limited can hold above the recent resistance band on strong volume, the tape favors short-term momentum over long-term trend-following.
Conclusion
CLIK sits at an interesting crossroads. On one side, Click Holdings Limited looks deeply discounted versus its revenue and book value, backed by over $10M in cash and limited long-term debt. On the other side, the chart tells a story of hesitation: big wicks, intraday reversals, and a closing price that keeps slipping back toward the lower end of the recent range.
For active traders, that mix demands discipline. CLIK’s spikes into the $1.30–$1.60 zone show that when volume comes in, this stock can move fast. But the repeated fades back toward $1.10 remind everyone that liquidity works both ways. Click Holdings Limited has become a textbook example of why entries and exits matter more than stories. Chasing those spikes without a plan is where many newer traders get into trouble, especially when they let emotions take over.
The key now is how CLIK behaves around that $1.06–$1.09 support band and whether it can reclaim and hold the mid-$1.20s with real volume behind it. Until then, traders should treat Click Holdings Limited as a short-term trading vehicle, not a “set it and forget it” idea. As Tim Sykes loves to say, “Trade the price action, not the hype.” As millionaire penny stock trader and teacher Tim Sykes, says, “There is always another play around the corner; don’t chase just because you feel FOMO.”. For CLIK, that means focusing on the chart, the levels, and strict risk management—nothing else.
This is stock news, not investment advice. Timothy Sykes News delivers real-time stock market news focused on key catalysts driving short-term price movements. Our content is tailored for active traders and investors seeking to capitalize on rapid price fluctuations, particularly in volatile sectors like penny stocks. Readers come to us for detailed coverage on earnings reports, mergers, FDA approvals, new contracts, and unusual trading volumes that can trigger significant short-term price action. Some users utilize our news to explain sudden stock movements, while others rely on it for diligent research into potential investment opportunities.
Dive deeper into the world of trading with Timothy Sykes, renowned for his expertise in penny stocks. Explore his top picks and discover the strategies that have propelled him to success with these articles:
- Penny Stocks Trading Guide
- Best Penny Stocks Under $1 to Buy Today
- Top 8 Penny Stocks to Watch on Robinhood
Once you’ve got some stocks on watch, elevate your trading game with StocksToTrade the ultimate platform for traders. With specialized tools for swing and day trading, StocksToTrade will guide you through the market’s twists and turns.
Dig into StocksToTrade’s watchlists here:





Leave a reply