

Bloom Energy Corporation stocks have been trading up by 1.8 percent amid strong investor optimism over its latest clean-energy initiatives.
Key Takeaways Traders Need To Know
- Q3 2026 results from Bloom Energy crushed expectations, with EPS at $0.94 and revenue at $1.24B, more than doubling from $519M a year earlier.
- Management lifted 2026 revenue guidance to $4.4B–$4.6B and adjusted EPS to $3.10–$3.40, both well ahead of current Street estimates.
- Growth expectations jumped, with Bloom Energy now targeting more than 120% year‑on‑year revenue growth in 2026 and highlighting backlog and pipeline expansion across sectors and regions.
- Major banks including Morgan Stanley, BMO, Baird, Roth, JPMorgan, and RBC raised price targets on BE into the $260–$351 range and reiterated bullish ratings despite a post‑earnings pullback.
- The company is positioning BE as a play on surging U.S. power demand and potential carbon capture projects, while keeping its brand visible through first‑responder donations and ESPN college football sponsorships.
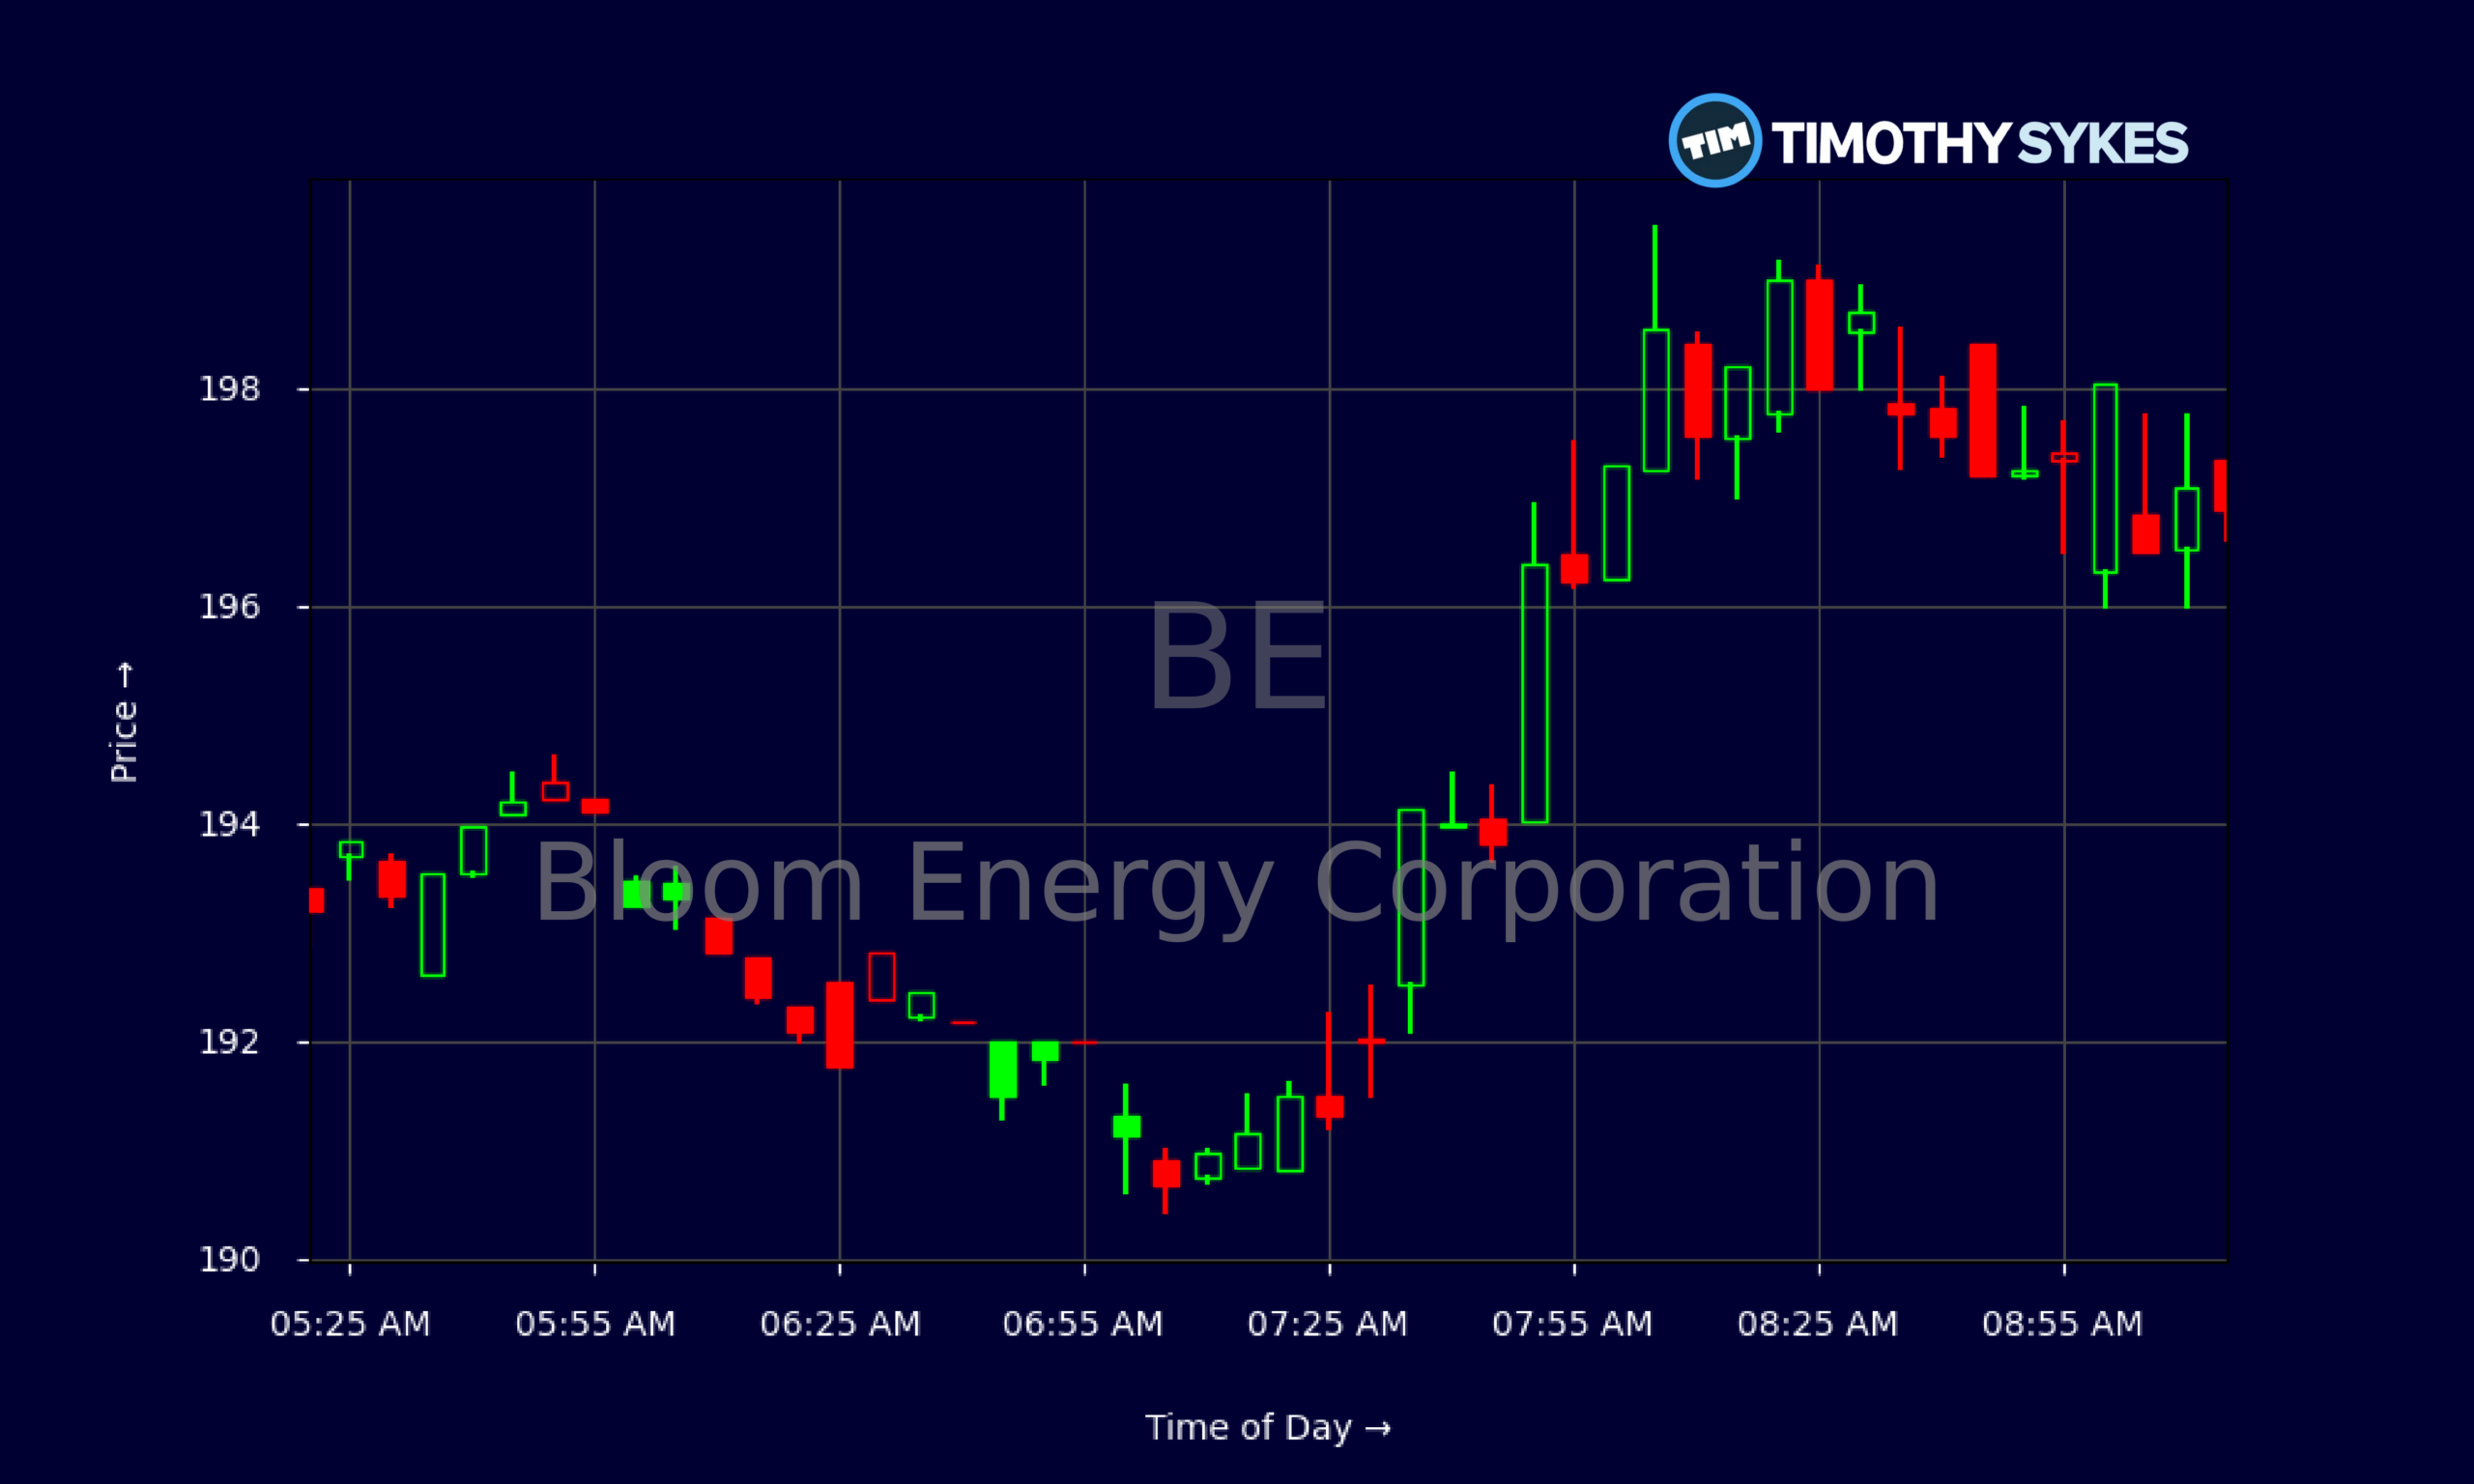
Live Update At 09:19:25 EDT: On Monday, October 26, 2026 Bloom Energy Corporation stock [NYSE: BE] is trending up by 1.8%! Discover the key drivers behind this movement as well as our expert analysis in the detailed breakdown below.
Quick Financial Overview
Bloom Energy (BE) just posted the kind of quarter momentum traders look for. Q3 adjusted EPS came in at $0.94, not only ahead of the $0.67–$0.69 consensus range but also a massive jump from $0.15 a year ago. Revenue hit $1.24B, beating the $1.07B forecast and more than doubling last year’s $519M. That tells traders demand for BE’s onsite power systems is not a slow grind — it’s accelerating.
The latest daily chart shows how the stock has been repricing this story. Earlier in the month BE traded near $295, then slid to around $193.30 by the most recent close. That’s a sharp reset of roughly one‑third from the highs, even as fundamentals improved. Intraday, BE is now grinding in a tight band between about $190 and $199 on 5‑minute candles, signaling consolidation after heavy volatility.
More Breaking News
On the fundamentals side, BE is growing fast — revenue over the past few years has risen at roughly a 30% clip — but the stock still trades at a rich price‑to‑sales multiple around 26.5x. Profitability is emerging, with EBIT margin near 9.5% and strong gross margin above 31%. The balance sheet shows solid liquidity, with a current ratio over 4. For traders, that mix screams high‑beta growth: big upside swings when sentiment is hot, and equally sharp pullbacks when the market questions valuation.
Why Traders Are Watching BE After The Earnings Shock
BE’s latest earnings beat is not just a small surprise; it is a structural shift in the story. Bloom Energy delivered Q3 numbers that outpaced already bullish expectations on revenue, EBITDA, and EPS. When a company moves from $519M in quarterly revenue to $1.24B in a year, and lifts adjusted EPS from $0.15 to $0.94, traders are seeing operating leverage kick in hard.
Management didn’t stop at a strong quarter. Bloom Energy raised its 2026 revenue outlook to $4.4B–$4.6B and pushed adjusted EPS guidance up to $3.10–$3.40. Those ranges now sit well ahead of current consensus, meaning the Street is behind the company’s own targets. BE also hiked its 2026 growth outlook from roughly 60% to more than 120% year‑on‑year at the midpoint, backed by a backlog and pipeline growing faster than current revenue. For active traders, that kind of forward‑looking confidence often forces model revisions, which can re‑rate a stock over time.
Wall Street has taken notice. Morgan Stanley lifted its price target on BE to $335 and kept an Overweight, citing repeated guidance raises and “continued strong execution.” BMO and Roth moved their targets to $260, while Baird pushed to $351. RBC remained bullish even after a double‑digit share price drop on the earnings day. JPMorgan trimmed its target to $292 from $314, but only because sector multiples compressed — it still calls BE Overweight.
That mix tells traders something important: the pullback is not about the business breaking. It’s about the market digesting a high‑valuation, high‑growth name in a choppy environment. Meanwhile, Oppenheimer points to potential upside from data‑center‑driven carbon capture work like Oracle’s Project Jupiter, helped by 45Q tax credits. Add in Bloom Energy’s community‑facing donations to first responders and ESPN college football sponsorships, and BE is working both the fundamental and brand angles while the chart cools off.
Conclusion
For active traders, BE is a classic case of great numbers meeting messy price action. Bloom Energy just delivered one of its strongest quarters on record, lifted 2026 guidance for both revenue and EPS, and showed that its backlog and pipeline are expanding faster than current sales. Yet the stock sold off from the high‑$200s to around $190, handing back a big chunk of recent gains.
That disconnect is where trading opportunity lives. Analyst targets on BE now cluster roughly in the $260–$351 band, far above current levels, and most major firms keep bullish ratings. At the same time, the valuation remains aggressive, sector multiples are under pressure, and the chart is in a clear downtrend from early‑month highs. Short‑term traders have to respect both realities: strong fundamentals and unforgiving price action. As millionaire penny stock trader and teacher Tim Sykes says, “It’s not about how much money you make; it’s about how much money you keep.” In a volatile name like BE, that mindset can help traders focus on risk management and capital preservation even when the upside looks compelling.
The key with Bloom Energy now is discipline. Watch how BE behaves around this $190–$200 consolidation zone, how volume reacts on bounces versus fades, and how quickly the Street raises its numbers to match management’s outlook. As Tim Sykes always says, “React, don’t predict — the chart will tell you everything if you’re prepared.” This article is for educational and research purposes only, but for those who track momentum, volatility, and guidance trends, BE deserves a spot on the watchlist.
This is stock news, not investment advice. Timothy Sykes News delivers real-time stock market news focused on key catalysts driving short-term price movements. Our content is tailored for active traders and investors seeking to capitalize on rapid price fluctuations, particularly in volatile sectors like penny stocks. Readers come to us for detailed coverage on earnings reports, mergers, FDA approvals, new contracts, and unusual trading volumes that can trigger significant short-term price action. Some users utilize our news to explain sudden stock movements, while others rely on it for diligent research into potential investment opportunities.
Dive deeper into the world of trading with Timothy Sykes, renowned for his expertise in penny stocks. Explore his top picks and discover the strategies that have propelled him to success with these articles:
- Penny Stocks Trading Guide
- Best Penny Stocks Under $1 to Buy Today
- Top 8 Penny Stocks to Watch on Robinhood
Once you’ve got some stocks on watch, elevate your trading game with StocksToTrade the ultimate platform for traders. With specialized tools for swing and day trading, StocksToTrade will guide you through the market’s twists and turns.
Dig into StocksToTrade’s watchlists here:





Leave a reply