

American Airlines Group Inc. stocks have been trading up by 6.4 percent after strong travel demand and earnings outperformed expectations.
Key Takeaways
- Q3 adjusted EPS of -$0.28 beat expectations for a -$0.36 loss, as American Airlines Group Inc. posted record revenue of $16.34B despite a 67.5% jump in fuel costs.
- Revenue of $16.34B edged past the $16.21B consensus, and AAL guided to another quarter of record revenue growth while working to restore profitability in a high-fuel setup.
- Spending on Citi co-branded cards rose 10% year over year, with richer AAdvantage Platinum Select and AAdvantage Business card rewards slated for 2027 under the Citi and Mastercard partnership.
- Morgan Stanley and Freedom Broker both cut AAL price targets but kept bullish ratings, pointing to strong revenue and cost discipline offset by fuel-driven losses.
- Management flagged capacity discipline, 2027 unit revenue upgrades, M&A openness, and a November 9 virtual meeting with Benchmark as key parts of AAL’s evolving strategy.
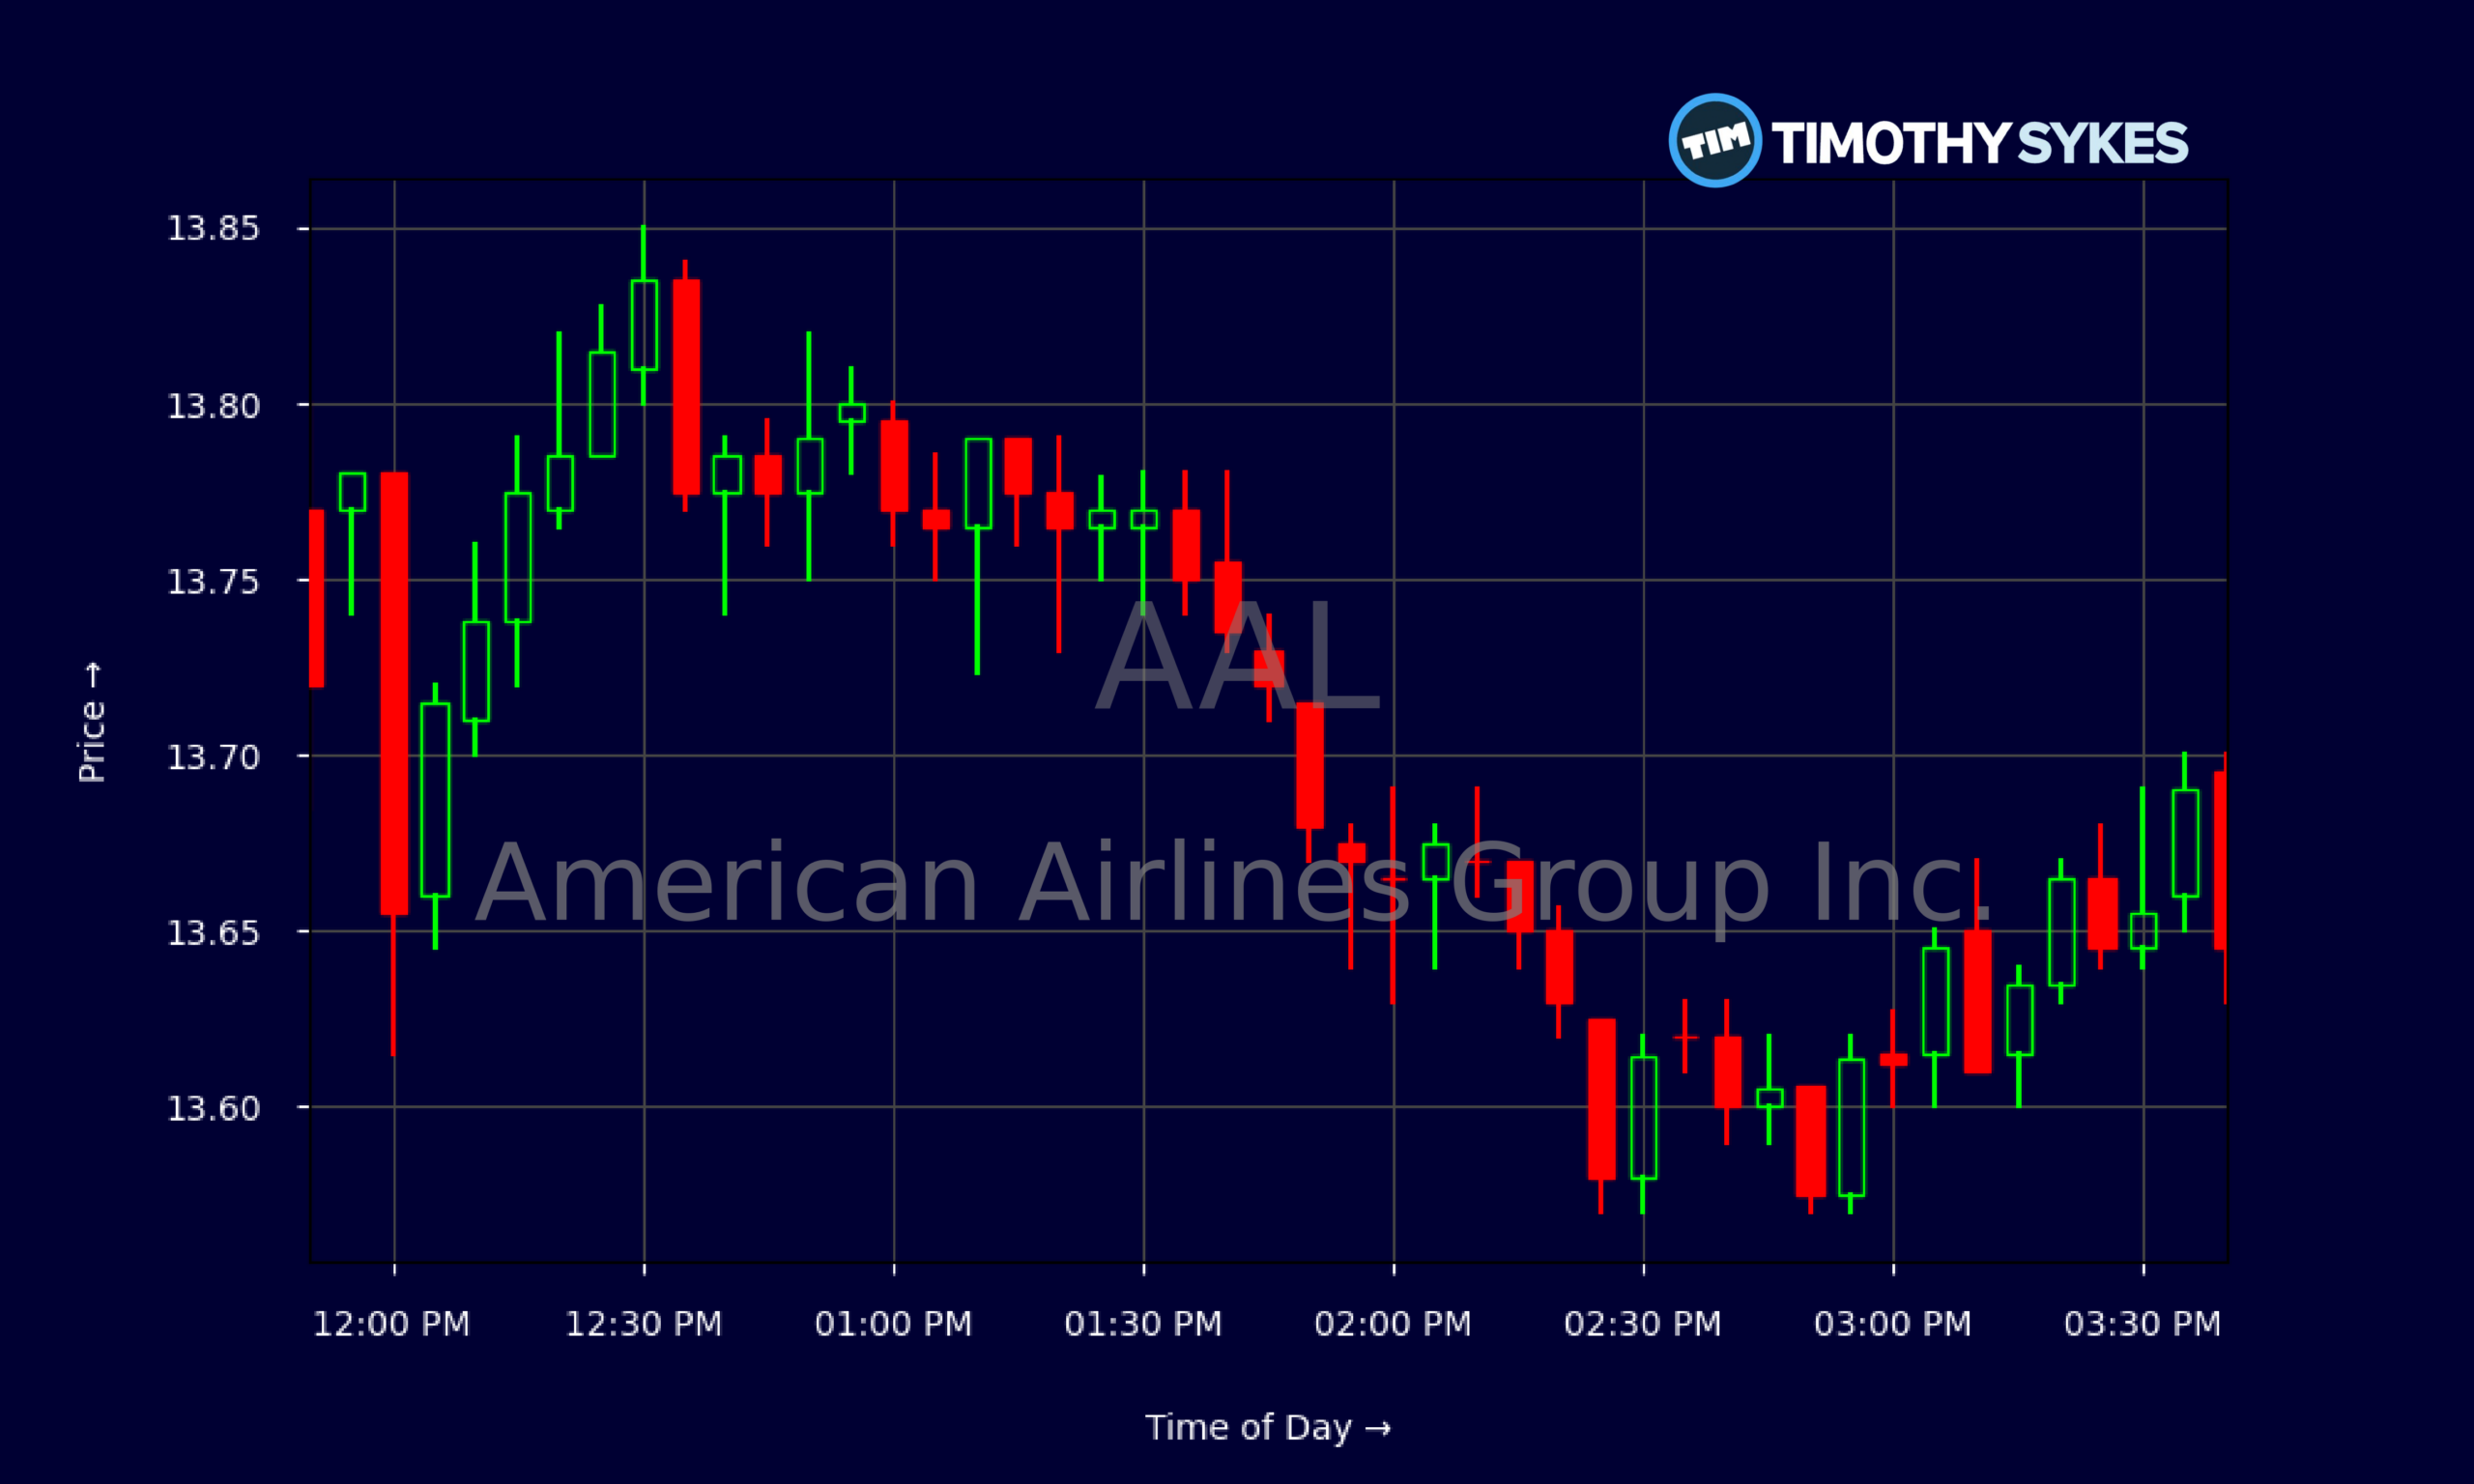
Live Update At 15:47:27 EST: On Wednesday, November 04, 2026 American Airlines Group Inc. stock [NASDAQ: AAL] is trending up by 6.4%! Discover the key drivers behind this movement as well as our expert analysis in the detailed breakdown below.
Quick Financial Overview
AAL’s chart has quietly been grinding higher. Over the past few weeks, American Airlines climbed from the low $12s to around $13.65, with a series of higher lows from 2026/10/16 onward. That is exactly the kind of steady uptrend short-term traders like to stalk.
The intraday tape reinforces that view. On the latest session, AAL opened near $13.44, dipped below $13.40, then pushed toward $13.85 before closing at $13.645. Most of the afternoon 5‑minute candles sat in a tight $13.60–$13.80 range. That sideways action after a push higher often signals consolidation rather than immediate exhaustion.
Fundamentally, American Airlines is still a turnaround story. The company generated $16.34B in quarterly revenue and about $54.63B over the last year, yet margins remain razor thin. Profitability ratios show an EBIT margin near 2.2% and a negative overall profit margin, which tells traders that small macro shocks—like fuel spikes—can swing earnings hard.
More Breaking News
Leverage is heavy. AAL sits on roughly $37.4B in enterprise value, with long-term debt of about $25.94B and negative equity. A current ratio of 0.5 and quick ratio of 0.4 highlight tight liquidity. For traders, that mix—improving price action but a stretched balance sheet—sets up a name that can move fast on any change in sentiment or guidance.
Why Traders Are Watching AAL Right Now
The core of the current AAL story is simple: demand is there, profits are not—yet. In Q3, American Airlines turned in adjusted EPS of -$0.28, better than the expected -$0.36 loss. Revenue hit a record $16.34B, just above the $16.21B consensus. Premium cabins and commercial initiatives are pulling their weight, but that 67.5% year-over-year surge in fuel expense pushed the airline back into the red.
For momentum traders, that kind of “beat but still loss-making” setup often becomes a tug-of-war. On one side, you have solid top-line growth and guidance for another quarter of record revenue. On the other, you have macro costs that AAL cannot fully control. That tension is exactly what drives volatility.
Wall Street’s reaction underscores this mixed view. Morgan Stanley trimmed its AAL price target to $22 from $24 but kept an Overweight rating, highlighting a solid quarter and a decision to slow growth because of fuel. Freedom Broker followed a similar playbook, cutting its target to $17 from $18 while reiterating a Buy rating. Both shops are saying the same thing in trader language: the story is intact, but the near-term earnings bar is lower.
The more strategic piece—and what many chart-watchers may be underpricing—is the loyalty engine. American Airlines reported a 10% year-over-year jump in Q3 spending on its Citi co-branded cards. Starting in 2027, the Citi / AAdvantage Platinum Select and AAdvantage Business cards with Citi and Mastercard will offer higher earn rates on travel and everyday spend, new travel protections, statement credits, and partner perks, with annual fees climbing from $99 to $150.
For AAL, that is high-margin, fee-rich revenue that is less exposed to jet fuel than a basic seat sale. Management also laid out 2027 priorities aimed at lifting unit revenue and said it will “keep our eyes open” for M&A in the sector. Add a November 9 virtual Benchmark meeting to update the street, and traders have a clear calendar of catalysts that can spark fresh moves in AAL.
Conclusion
American Airlines Group Inc. sits at an interesting crossroads for active traders. The stock price is grinding higher, revenue is setting records, and the AAdvantage ecosystem with Citi and Mastercard is quietly turning into a bigger, more profitable machine. At the same time, AAL is still posting losses, carrying heavy debt, and wrestling with fuel costs that sliced into Q3 results and forced a reset of earnings expectations and price targets.
This mix often produces the kind of two‑sided action that day and swing traders love. Strong news on fuel, fares, or loyalty growth, and AAL can squeeze higher as shorts bail. Disappointing commentary at the November 9 Benchmark call, and the same leverage that helps on the way up works against the stock on the way down.
The key is to treat American Airlines like the volatile, cyclical name it is. Watch the chart levels around recent support in the low $12s and resistance near the mid‑$13s to $14, and overlay that with every update on revenue, fuel, and card economics. As Tim Sykes likes to say, “Trade like a sniper, not a machine gun.” As millionaire penny stock trader and teacher Tim Sykes, says, “It’s better to go home at zero than to go home in the red.”. For AAL, that means waiting for clean setups around earnings headlines, analyst moves, and loyalty strategy updates—then striking quickly, managing risk, and walking away if the trade breaks.
This is stock news, not investment advice. Timothy Sykes News delivers real-time stock market news focused on key catalysts driving short-term price movements. Our content is tailored for active traders and investors seeking to capitalize on rapid price fluctuations, particularly in volatile sectors like penny stocks. Readers come to us for detailed coverage on earnings reports, mergers, FDA approvals, new contracts, and unusual trading volumes that can trigger significant short-term price action. Some users utilize our news to explain sudden stock movements, while others rely on it for diligent research into potential investment opportunities.
Dive deeper into the world of trading with Timothy Sykes, renowned for his expertise in penny stocks. Explore his top picks and discover the strategies that have propelled him to success with these articles:
- Penny Stocks Trading Guide
- Best Penny Stocks Under $1 to Buy Today
- Top 8 Penny Stocks to Watch on Robinhood
Once you’ve got some stocks on watch, elevate your trading game with StocksToTrade the ultimate platform for traders. With specialized tools for swing and day trading, StocksToTrade will guide you through the market’s twists and turns.
Dig into StocksToTrade’s watchlists here:





Leave a reply