

Apollo Commercial Real Estate Finance Inc faces heightened pressure as credit market headwinds deepen, and its stocks have been trading down by -63.26 percent.
What Traders Need To Know
- A cash liquidating distribution of $4.10 per share is payable on 2026/10/29 to holders of record on 2026/10/20.
- The $4.10 payment is labeled an initial liquidating distribution under a approved plan of complete liquidation and dissolution.
- Around the payment date, shares will trade with due bills so the right to the $4.10 follows the stock, not just the record-date holder.
- The company plans to voluntarily delist from the NYSE in early 2026/11 and deregister from the SEC.
- Remaining assets and liabilities will move into a non-tradable Maryland liquidating trust, with holders getting non-transferable beneficial interests.
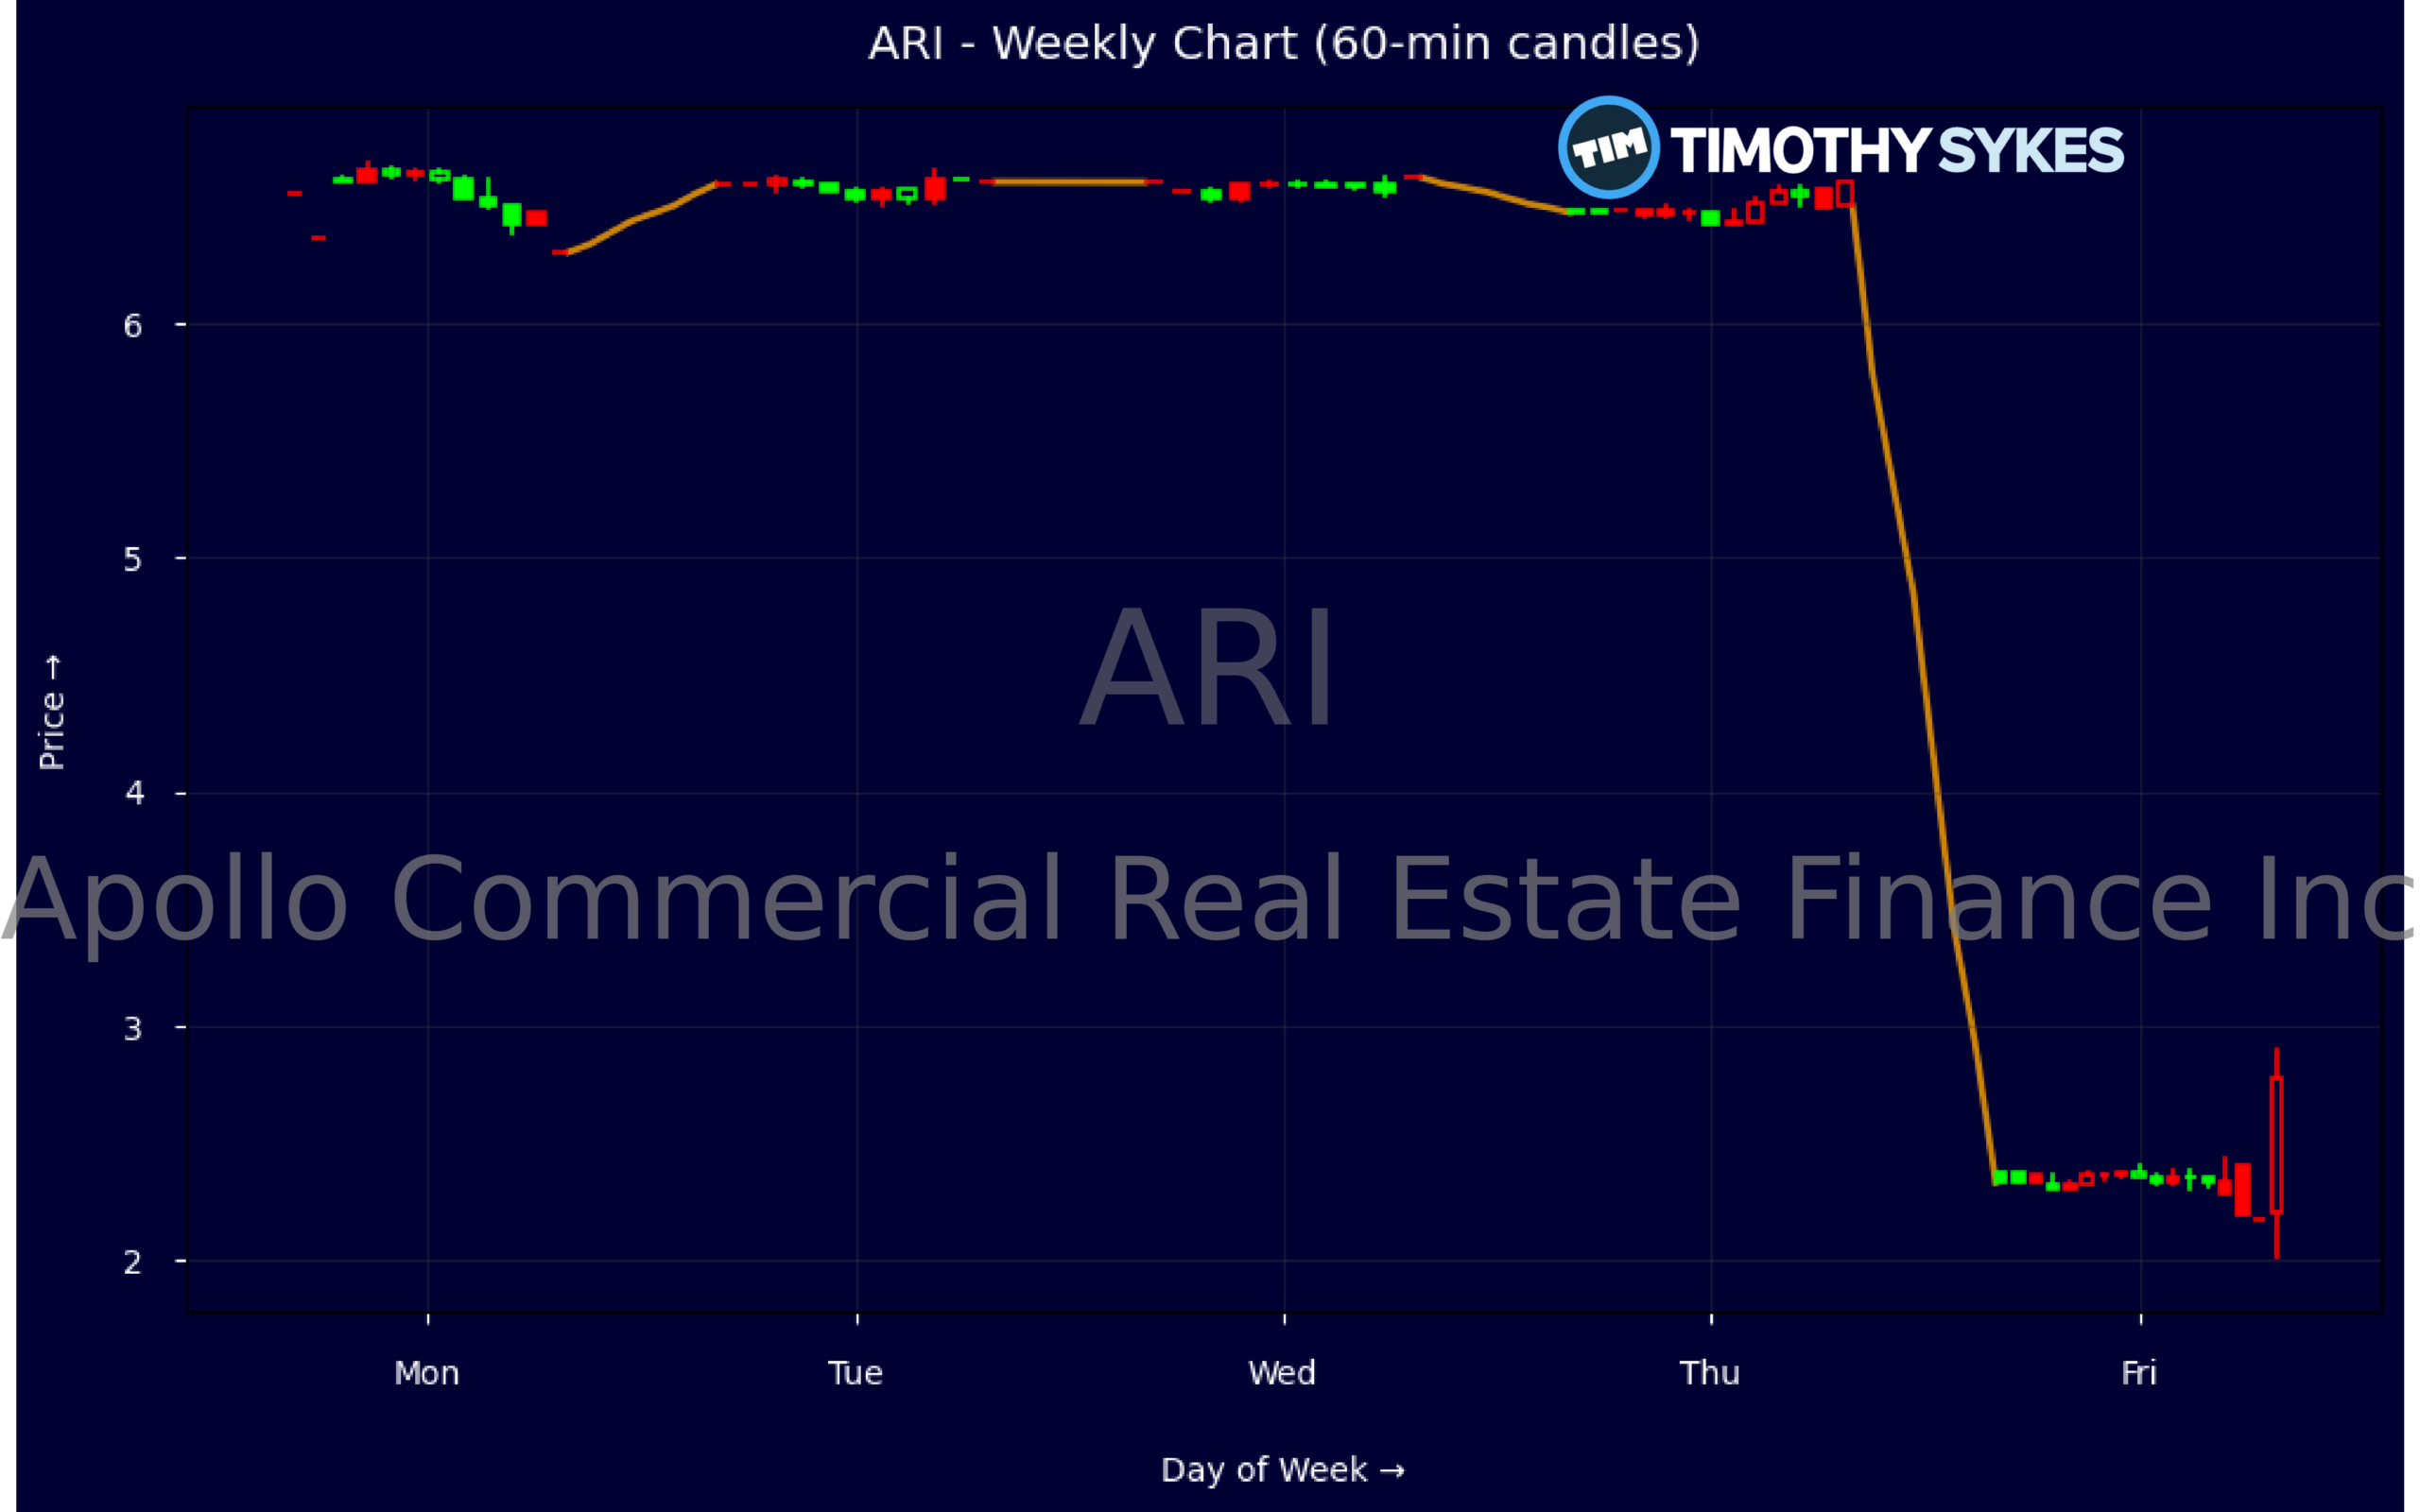
Weekly Update Oct 26 – Oct 30, 2026: On Saturday, October 31, 2026 Apollo Commercial Real Estate Finance Inc stock [NYSE: ARI] is trending down by -63.26%! Discover the key drivers behind this movement as well as our expert analysis in the detailed breakdown below.
Finance industry expert:
Analyst sentiment – negative
Apollo Commercial Real Estate Finance (ARI) is now essentially a liquidation vehicle rather than an ongoing mREIT. Reported revenue volatility and negative quarterly “TotalRevenue” reflect asset sales and restructuring, not core growth. Valuation screens optically cheap (P/E 7.8x, P/B 0.64x, price/cash flow 5.9x) but are largely irrelevant with a formal wind‑down in place. Key fundamentals are capital preservation: low leverage (assets/equity ~1.7x), ample cash ($1.24bn), and modest ROE (7.6%) supporting orderly distributions.
Technically, the stock showed stabilization around $6.50–6.60 earlier in the week, then collapsed to a $2.30–2.37 range on Oct. 30 as the $4.10 liquidating distribution and delisting plan became fully priced in. That gap-down redefines the dominant trend as terminal, not just bearish. Liquidity has likely spiked around the ex‑distribution pivot, with $2.30 now a critical support. Tactically, any bounce toward $2.80–3.00 is an opportunity to exit, not initiate new exposure.
Catalysts are fully defined: a $4.10 cash liquidating distribution, NYSE delisting, transfer of remaining assets into a non‑tradable Maryland liquidating trust, deregistration, and corporate dissolution. Versus finance and mortgage REIT benchmarks (e.g., broader mREIT indices yielding 12–15% on going‑concern models), ARI is no longer comparable; it is a finite‑life runoff. My verdict is outright avoid for new capital; existing holders should treat $2.30 as hard downside and target a total liquidation recovery near current implied value.
More Breaking News
Quick Financial Overview
Apollo Commercial Real Estate Finance Inc is no longer a normal yield REIT trade; it is now a liquidation story. The headline event is the $4.10 per share cash liquidating distribution, the first payout under a complete wind-down plan. For traders, that changes the game from watching quarterly dividends to tracking how much value can be pulled out of the balance sheet before the NYSE delisting and final dissolution.
Recent price action reflects that shift. In the weekly data, ARI traded tightly around the mid-$6 range for several days, then collapsed to roughly $2.37, a sharp repricing consistent with a market refocus on remaining liquidation value rather than ongoing earnings. The intraday 5-minute candle near $2.33–$2.40 shows compressed volatility after the flush, signaling that most of the easy directional move from the news may already be priced in.
Fundamentals frame the liquidation math. Apollo Commercial Real Estate Finance Inc reports revenue of about $272.8M with a profit margin above 40%, and a P/E near 7.8 plus a price-to-book around 0.64, which previously suggested a discounted REIT. Book value per share is about $9.79, and reported dividend metrics show historically high yield, but those signals now mainly serve as context for asset coverage, not future income. The balance sheet shows total assets near $2.14B and equity around $1.25B, while cash flow data reveals large asset sales and net debt paydown consistent with a run-off strategy.
Conclusion
This is stock news, not investment advice. Timothy Sykes News delivers real-time stock market news focused on key catalysts driving short-term price movements. Our content is tailored for active traders and investors seeking to capitalize on rapid price fluctuations, particularly in volatile sectors like penny stocks. Readers come to us for detailed coverage on earnings reports, mergers, FDA approvals, new contracts, and unusual trading volumes that can trigger significant short-term price action. Some users utilize our news to explain sudden stock movements, while others rely on it for diligent research into potential investment opportunities.
Dive deeper into the world of trading with Timothy Sykes, renowned for his expertise in penny stocks. Explore his top picks and discover the strategies that have propelled him to success with these articles:
- Penny Stocks Trading Guide
- Best Penny Stocks Under $1 to Buy Today
- Top 8 Penny Stocks to Watch on Robinhood
Once you’ve got some stocks on watch, elevate your trading game with StocksToTrade the ultimate platform for traders. With specialized tools for swing and day trading, StocksToTrade will guide you through the market’s twists and turns.
Dig into StocksToTrade’s watchlists here:





Leave a reply