Without a doubt, chart patterns are the single greatest discovery in my trading career.
In fact, it was a Supernova helped me earn my first $1 million back in 1999 and 2000.
Back then, I didn’t understand what I was looking at, only that I saw huge potential.
Intuitively, I bought breakouts and rode the wave higher and higher.
It wasn’t until years later I recognized that it was part of my 7-Step Penny Stocking Framework.
While markets have changed, the patterns remain the same.
As a trading mentor and teacher, I’ve taught thousands of students how to recognize these formations and use them to craft profitable trading strategies.
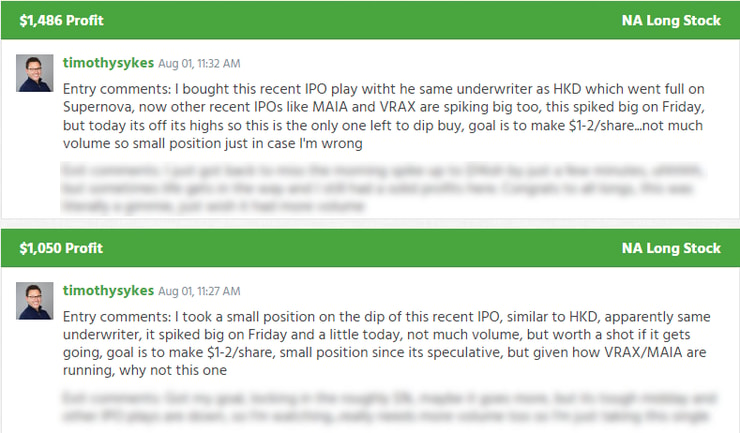
That’s why we’ll dive into my recent trade in Nano Labs Ltd. (NASDAQ: NA).
I post every trade I take RIGHT HERE for anyone to see.
It’s a perfect example of how I capitalized on one of the many HUGE opportunities.
So, let’s start with the pattern and then dig into the execution.
The Pattern

Most traders are familiar with popular patterns like the ‘bull flag’ or ‘double top.’
The one I’m most proud of is my Supernova.
As I mentioned, this pattern helped me earn my first $1 million.
But what many don’t realize is that like a real Supernova in space, it never really dies, it just changes forms.
That’s why I always look for Supernova patterns, even if I miss them.
I keep them on a watchlist because they often build the foundation of future trades.
But why am I talking about Supernovas when NA wasn’t one?
Because the lessons I teach using Supernovas can be directly applied to this stock.
NA was a recent IPO that started t by trading a couple of weeks before I took the trade.
Sometimes, the market for IPOs is hot. Other times, it’s like a breezeless ocean.
Right now, we’re in one of those hot cycles.
And get this…NA had the same underwriter as HKD…you know that stock which ran ~20,000% from its opening IPO print!
There has also been a rash of IPO spikers such as MAIA Biotechnology Inc. (NASDAQ: AMEX) and Virax Biolabs Group Limited (NASDAQ: VRAX).
Taken together, these puzzle pieces implanted the idea in my head NA might follow suit and spike.
Now, because the stock was so new, there’s extra risk involved. I wanted to make sure it wasn’t a dud.
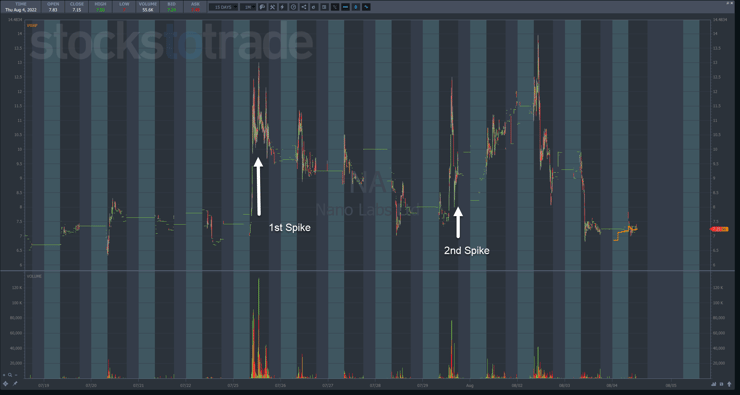
I followed it after the first spike on the 25th and then got very interested when it spiked again on the 29th.
You’ll notice that after a massive spike on Friday, the stock pulled back significantly on light volume.
Given the run other stocks had the last few days, I expected there would be an opportunity to buy shares on a pullback.
In a nutshell, I concluded that Monday should be bullish for the stock, at least off any pullbacks.
That’s what led to the dip buying framework.
The Execution
With this framework, I planned for a trade that should spike off a dip.
From there, the trade is pretty straightforward.
I simply look for a spike and pullback from which to enter the trade.
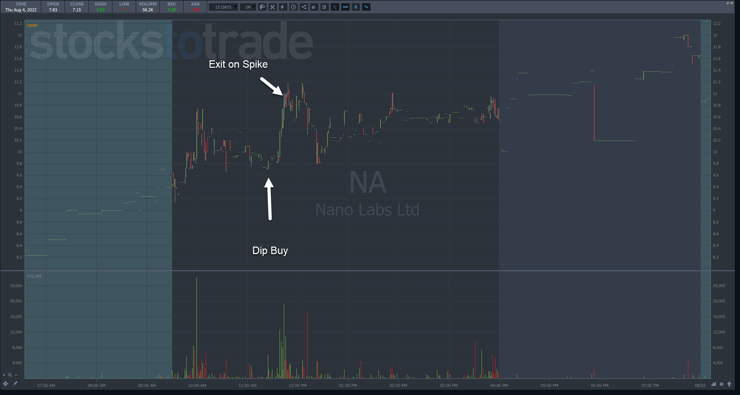
As you can see, shares spiked early, pulled back, and then held just above the open for the better part of an hour.
I entered the trade knowing that if the stock continued to float sideways or break down, I could just exit the trade.
Sure enough, right after I jumped in price jumped 10%, giving me a fantastic opportunity to sell into strength.
There’s something else to keep in mind here.
The entire range for this day fell inside Friday’s range.
Stocks are less likely to completely fall apart when they sit inside another day’s trading range.
However, as the following day demonstrated, once the stock spiked above Friday’s high and made a new all-time high, that’s when sellers really hit hard, sending shares plummeting.
I want to take the trades that offer consistent results rather than the ones with big payouts.
More Breaking News
- Tenaya Therapeutics: Riding the Biotech Wave or Approaching a Market Crest?
- Vestis Corporation’s Stock Surges: What’s Driving the Market Buzz?
- Is FormFactor Inc. Positioned for Growth After Partnering with SK Hynix?
That’s how I’ve made my trading career with the pattern that’s allowed me to keep at it for more than two decades.
Final Thoughts
Every trade needs a pattern to develop a thesis.
From there, you can create the trade setup inside of that framework.
If you try to create a setup without the pattern, it lowers the odds of success.
—Tim


Leave a reply