In part 3 of the 4 Things to Watch in 2020 series, we’re gonna take a look at former runners. If you haven’t read Part 1: Short Squeezes and Part 2: Hot Biotechs…
… be sure to read them as soon as you finish reading this post. Take notes from this series. These are just a few of the stocks I’ve watched recently.
Along with the stocks in this post, watch former runners related to the coronavirus outbreak. Many of the same stocks that spiked during the 2014 Ebola outbreak are in play again. I’m working on a dedicated coronavirus post now.
👉🏼SUBSCRIBE to my FREE weekly stock watchlist here.
After two decades of trading, I’ve noticed…
Table of Contents
Stocks Have Characteristics

2025 Millionaire Media, LLCStocks tend to have characteristics. What do I mean by that?
If a stock behaves a certain way one time, it can happen again. And if it does happen again, the chance of it happening multiple times increases.
I’m fortunate because I’ve been doing this for over 20 years. So I know these characteristics pretty much inside out. So this is about learning one particular characteristic of penny stocks…
Former runners can run again.
Thank you @timothysykes for teaching me to buy FORMER RUNNERS, on a DIP, with high VOLUME …long $CIFS @ 1.16 out at 1.29 …hit 1.45 but i took meat of the move …2 years ago i didn’t know shit bout the market let alone those 3 key factors …happy holidays
— Pete Falcone (@PeteFalcone0101) December 13, 2019
In other words, history repeats. (Remember it’s not an exact science. This is something to watch for … not a prediction service.)
Before I get to examples, there’s one other thing to consider. Some stocks have stories…
Pay Attention to Story Stocks
So, I always say focus on big percent gainers. But you also have to focus on a few story stocks. What’s a story stock? They’re stocks where the story behind the company or its products excites investors.
Two of the former runner examples in this post are story stocks. You’ll see what I mean with Astrotech and Ignite brands.
Let’s get to some examples of former runners I’m watching.
Recent Examples of Former Runners
This list of four former runners I’ve been watching and/or trading is only a small sample.
https://t.co/ED5DWo667t I love my FGD plays on former runners!
— Timothy Sykes (@timothysykes) January 6, 2020
So use these examples to drive home the idea. When a stock runs, check to see if it has a history of running.
Ignite International Brands Ltd (OTCQX: BILZF)
The first example of a former runner I’m watching is Ignite — Dan Bilzerian’s weed company.
Take a look at the BILZF six-month chart:
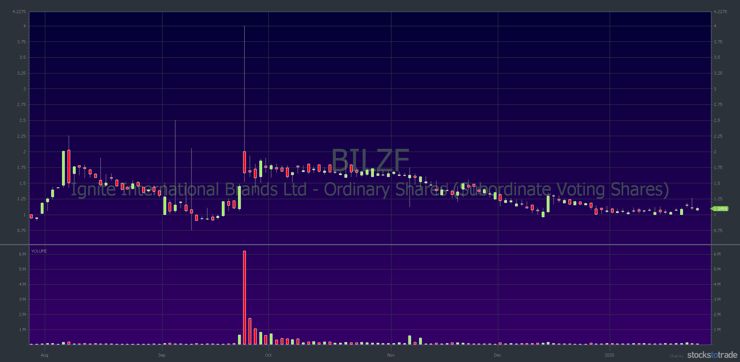
The chart doesn’t look like much, especially over the past 100 days. But it did have a big spike from the $1.20s all the way to $4 in 24 hours. (See the huge volume spike on the chart.)
The spike happened when Bilzerian posted to his social media account. What did he say? He let his followers know that they could now invest in his company with a U.S. ticker.
BILZF Is a Story Stock
BILZF is an example of a story stock. Dan Bilzerian has a huge social media following. So even though the chart is kinda quiet now…
… if he posts something or if there’s news … it could spike again. So you still have to watch it.
I last traded this stock in September during my annual conference. But I’m still watching it for two reasons. First, the guy has a lot of followers. Second, he knows how to make money.
So you gotta think he’s working on some deals. Any one of those deals — when they get announced — could spike the stock. My guess is, he’ll probably be proud of any deal and post it on social media.
So you won’t just have the press release from the deal, you’ll also get Bilzerian’s social media post. And in his post, he’ll talk about the press release and talk about the deal. He might even link to the deal.
He’s basically his own publicist (given his following). So this stock is worth watching.
Note: On January 20, Ignite announced it’s adding beverages to its list of products. The stock really didn’t do much. Again, I’ll keep watching in case Dan Bilzerian’s followers get interested. As I write, he hasn’t posted about the deal on social.
On to another example of a former runner…
More Breaking News
- D-Wave Quantum’s Dramatic Drop: A Market Opportunity?
- AAPL Shares Soar: What’s Next?
- BULL Stock: Will Momentum Last?
ShiftPixy, Inc. (NASDAQ: PIXY)
PIXY is in a totally different sector. It’s involved with the gig economy — kinda Uber-like but for staffing. It recently sold off 60% of its business to focus primarily on restaurants. I traded this stock on January 24. It was a very undisciplined trade and resulted in my biggest loss this year.
Learn the lessons from that trade in this post about trading discipline. But first, let’s see why the stock was on my watch list.
Here’s the PIXY one-month chart:
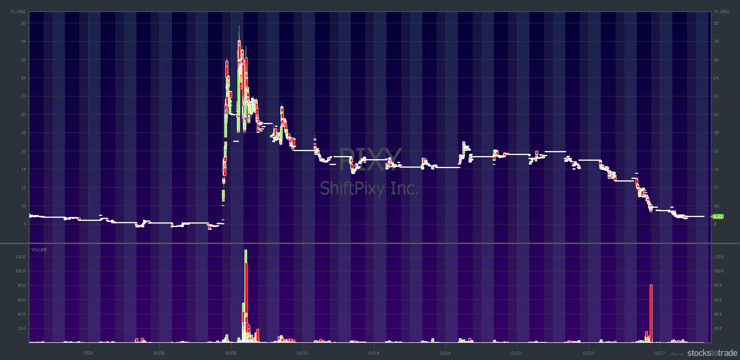
The stock spiked from $7 all the way up to $28 on the news. Then it dropped back to trade in a range between roughly $13.50 and $16.50 for several days. But even though it was down, it proved it can spike. If you look at a one-year chart, it doesn’t look that amazing.
But this isn’t the first spike. You have to go back further. Here’s the three-year chart:
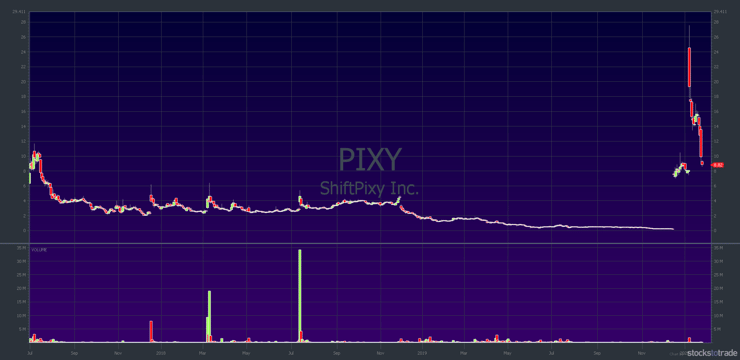
As you can see, PIXY had a big one-day spike back in December 2017. Then another in March 2018 … and another in July 2018. They might not look like much on the chart, but they were big percent gains. And they’re proof the stock can spike, which is why PIXY was on my watch list.
The next example is another story stock…
Astrotech Corporation (NASDAQ: ASTC)
I’ve traded ASTC multiple times. Every single time it spiked, there was news about its detection equipment. It has this new security detection equipment for airports. Theoretically, if more airports use the detection equipment, it could be a big hit.
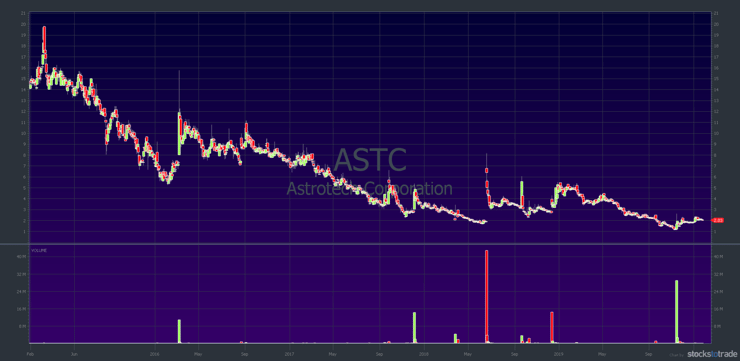
Take a look at the ASTC two-year chart:
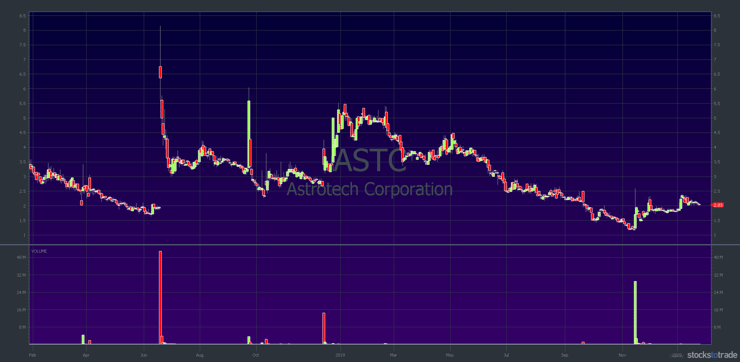
As you can see, ASTC had several big one-day spikes in June, September, and December 2018. Then another in November 2019.
It never really sustains its gains. I think the technology is probably a little more complicated than the company lets on. But … it has spiked in the past.
So remember plays that have spiked in the past. They’re not necessarily gonna spike on any given day. But they can.
Again, it’s not an exact science. My goal is to make you aware of the possibility of another spike in the future. So remember former runners.
Here’s the final example…
Trillium Therapeutics Inc. (NASDAQ: TRIL)
TRIL is the most recent of the three. The stock has a terrible two-year chart. Check it out…
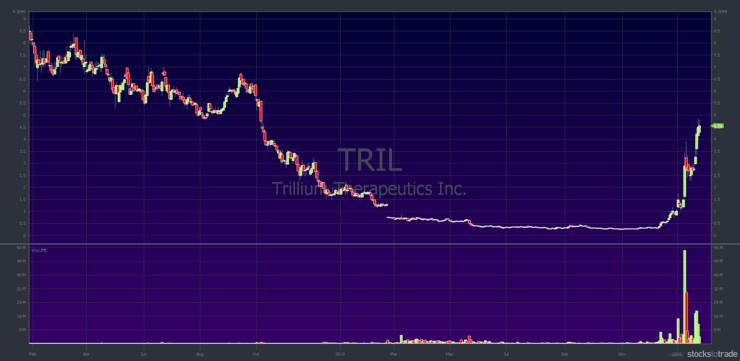
But if you look back — or if you remember — it had a helluva run-up back in 2015.
Check out the TRIL five-year chart:
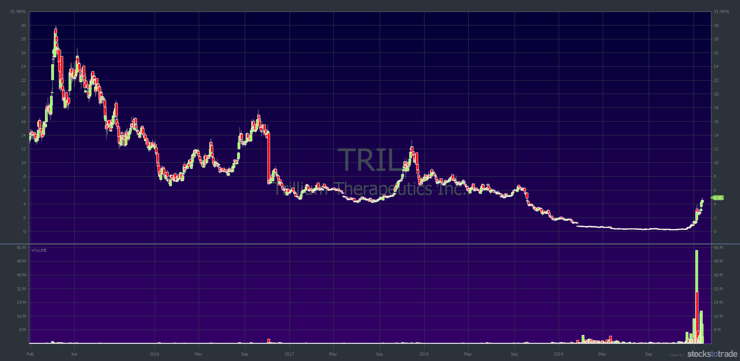
Even though it doesn’t look like that much on the chart … when it goes from $9 to $18 in a few weeks…
… then goes from $5 to $12 over a few weeks…
… you start to learn how it runs.
TRIL tends to run for several weeks at a time. This latest runup — over the past month — is no different. Versus ASTC where it was very much one-and-done over five years…
So it’s not only a matter of remembering former runners. You also have to remember how they ran…
Study the Past for Penny Stock Trading Success
If you really want long-term success trading penny stocks it’s imperative you study the past. I say it all the time. Over and over again. Study the past to prepare for the future.
New to penny stocks? Get access to my FREE penny stock guide here. Go through it at least five times.
In the Stock Market, Experience Pays
Again, I’ve been doing this for over 20 years. During that time, I’ve learned to recognize certain characteristics. And I remember stock tickers — especially if I’ve traded them. But it’s part of the deal. You kinda have to get to know this.
Admittedly, I have an advantage. If you weren’t around for any of the previous spikes, you wouldn’t know the difference between ASTC and TRIL. Unless you study the past.
But I was there for every single one of those spikes. I remember how ASTC was all one-and-dones. And I remember how TRIL went further, and longer, than most people expected.
Know Your Stock Market History
nailed $BITCF missed $NADL ..same pattern – have you watched @timothysykes pennystocking framework – easy money dip buying former runners!!
— Mark Croock (@thehonestcroock) April 20, 2017
This is a great example of why I tell students to study the past. Look at longer-term charts. If you see something running, take a deep breath and check. Use StocksToTrade to see if it’s a former runner. If it is … how did it run in the past? What kind of volume did it have? Take time to prepare instead of just jumping in.
If you miss it? There will always be another trade. Next time you’ll know what to look for … faster.
Understand What’s Happening Now
Another thing you should consider…
It’s not enough just knowing former runners. And it’s not enough to know how they ran in the past. You also need to know what’s happening now.
Here’s an example…
How to Use History to Gain an Advantage
As you know from 4 Things to Watch in 2020 — Part 1: Short Squeezes, short sellers are over-aggressive right now. And short sellers who’ve been around a while remember stocks like TRIL and ASTC.
So what do they do? They pound on stocks with a bad history of holding spikes.
What you get is an almost perfect storm. First, the short selling space is overcrowded. There are just too many people trying to short. Second, they’re overly aggressive. Finally, factor in the longest bull market in history…
… with the possibility of a stock actually holding its spike and you get…
… short squeeze mania.
A great example is CounterPath Corporation (NASDAQ: CPAH). I wrote about CPAH in part 1 of this series. Not only did it actually hold its spike, it continued to spike on January 10. Why? Because it had good news with Honeywell.
But the reason the spike was so big was … so many short sellers got over-aggressive and got squeezed.
So you gotta know a stock’s past history. But also know that it doesn’t work 100% of the time.
https://t.co/OYMVI0vROU @GT500 yes many do fail, but if you focus on the best former runners, earnings with multi-month breakouts the od…
— Timothy Sykes (@timothysykes) May 15, 2017
Here’s how to gain an advantage…
Get Experience
All traders lose. Just accept it. You will lose some of the time. I lose roughly 25% of the time … and I have exceptional skills developed over two decades. (See every trade I make here.)
You must gain experience. You have to work on your process. So the key is to…
Keep Losses Small While You Develop Your Process
Rule #1 is to cut losses quickly. If you have the self-discipline to always cut losses quickly, it keeps you in the game. Then you can find your best setups and work on your process.
Remember, it’s a marathon and not a sprint.
Keep Studying the Past
This post focuses on former runners … so it should be obvious. But too many people get lazy and don’t wanna keep studying. Keep studying. The more you study, the easier it’ll be to recognize patterns.
Here’s a good place to start…
People messaging me saying they’ve never seen such big moves on stocks like $HUNT $DCAR $WNDW $HYRE so please study this https://t.co/5cw7ALL8sI as these “big moves” are truly nothing new, you’re just under-studied…study the past, it IS still relevant now, now more than ever!
— Timothy Sykes (@timothysykes) March 26, 2019
And it’s not just the patterns. By studying the past you’ll learn about all the indicators that can move a stock. You’ll learn about sector momentum. You’ll see how news can affect certain stocks.
Remember the Lessons of the Past
This applies to big market moves and also certain types of news catalysts.
For example, the recent Wuhan coronavirus headlines are similar to the Ebola outbreak a few years back. That turned out to be mostly hype — thankfully. But you never know how far these can go.
Note: I’m not planning to be aggressive with virus stocks during this scare. First, it’s tough … you’re dependent on breaking news and bad news. Or news of more deaths — which I don’t like. Second, it’s not predictable. You actually have to be there when the news hits.
The point is, remember the lessons. I’m basically a glorified history teacher.
To sum it up…
… traders with more experience, who stay in this game, look back at history, and don’t forget the lessons of the past…
… have an advantage.
Develop Your Trading Skills
I trade with these rules and use these brokers.
Like anything in life, just knowing the information isn’t enough. If you want to gain financial freedom trading penny stocks, you have your work cut out for you.
Based on 20 years of experience trading and a decade of teaching…
… I suggest you get a mentor.
Choose Your Level of Commitment

2025 Millionaire Media, LLCOnly you can decide how much time you want to put into this.
But I will say this…
… my goal is to be the mentor to you that I never had. That’s why I started teaching. And it’s why my team and I continue to work so hard to give you the best materials and content possible.
For the truly dedicated … (it’s not easy, and not everyone gets in)…
The Trading Challenge
The Trading Challenge is my most comprehensive course. You get video lessons, webinars, watchlists, trade alerts, and the Challenge chat room.
This program is not for lazy losers or tire kickers. You will have to go through an interview process to get in. Got what it takes? Apply for the Trading Challenge today.
Pennystocking Silver
Pennystocking Silver is a monthly subscription service. You get access to over 6,000 video lessons, a daily watchlist, the TimAlerts chat room, and more. Some people start here and then upgrade to the Trading Challenge later. Again, your level of dedication is up to you…
What do you think of this post? Comment below, I love to hear from you!






Leave a reply