

Olenox Industries Inc. stocks have been trading up by 42.5 percent after winning a transformative multibillion-dollar defense contract
Key Takeaways
- OLOX has sold off hard from an early spike above $1.80, closing under $0.75 as volatility stays elevated.
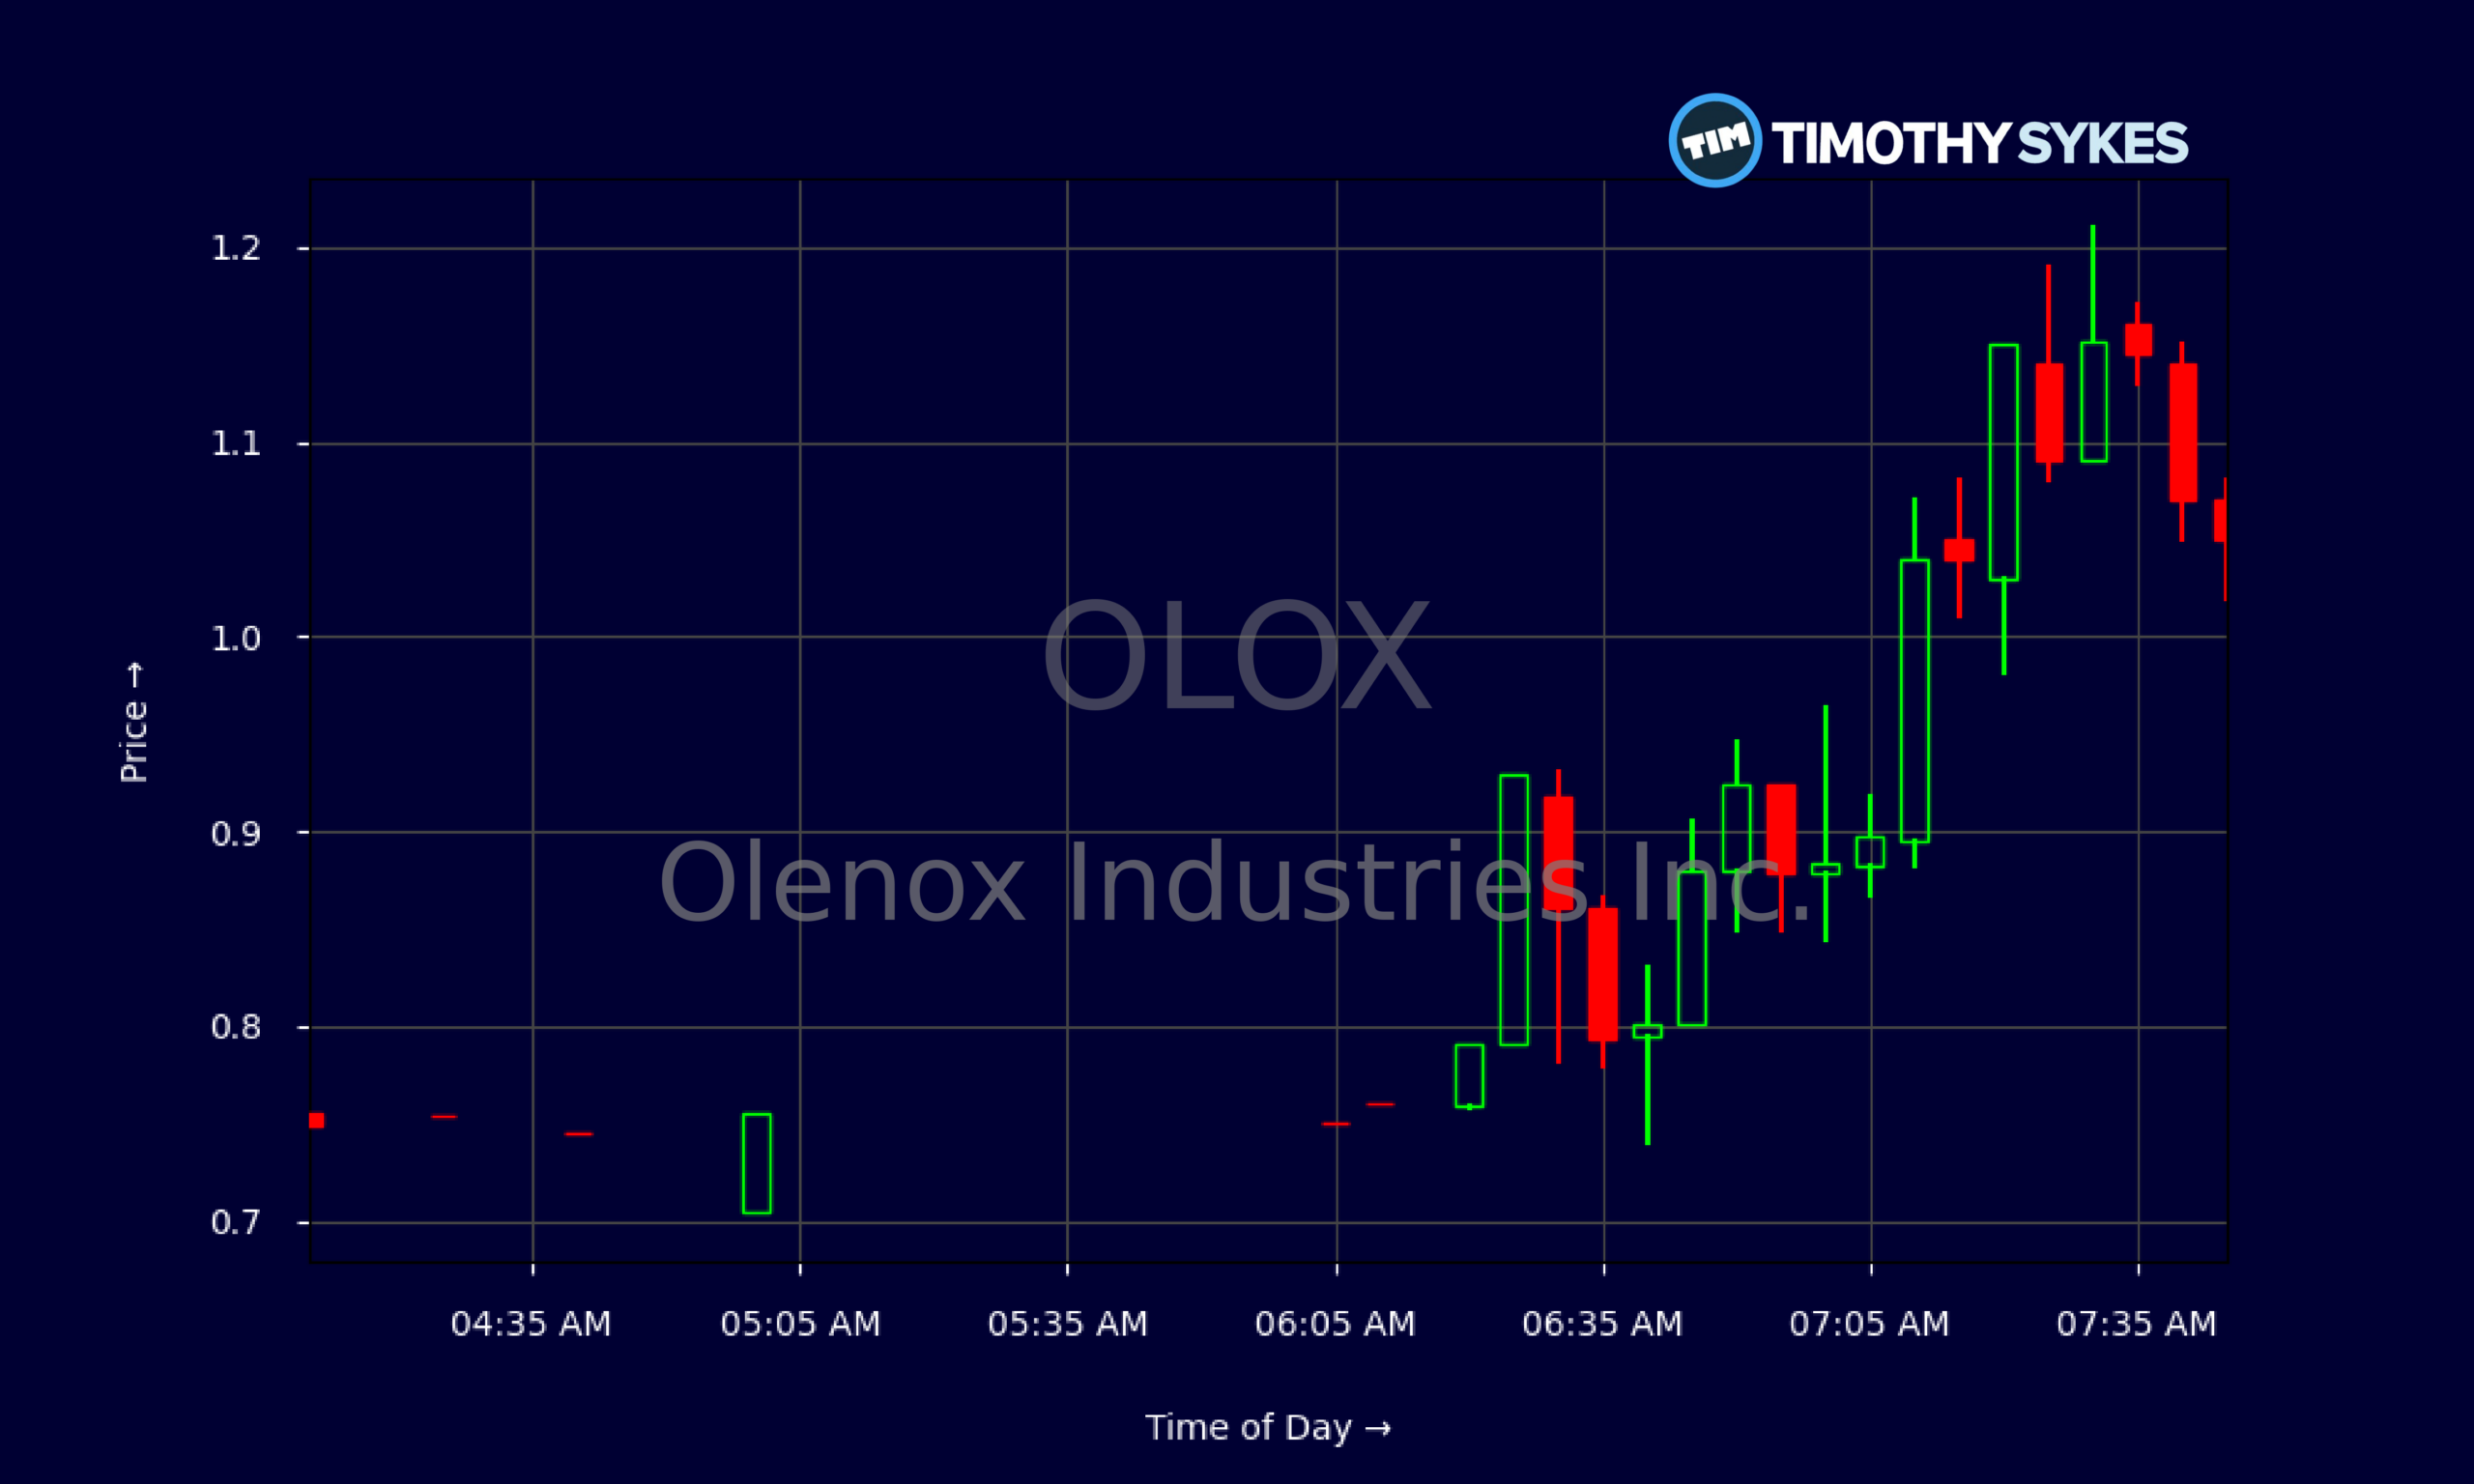
- Intraday action shows Olenox Industries Inc. bouncing from the $0.75 area into the $1.20s, then fading, signaling active day-trading interest.
- Financials show OLOX with roughly $2.9M in revenue but deep losses and sharply negative margins.
- Olenox Industries Inc. carries heavy debt, a weak current ratio near 0.1, and negative working capital, putting balance sheet pressure front and center.
- Traders are watching whether OLOX can hold recent lows while the ultra-low price-to-book ratio hints at a classic beaten-down speculative setup.
Live Update At 07:47:23 EDT: On Wednesday, October 21, 2026 Olenox Industries Inc. stock [NASDAQ: OLOX] is trending up by 42.5%! Discover the key drivers behind this movement as well as our expert analysis in the detailed breakdown below.
Quick Financial Overview
OLOX is trading like a distressed small-cap, and the numbers back that up. Olenox Industries Inc. reported about $2.1M in quarterly revenue and roughly $2.95M on a trailing view, but expenses are running far ahead. Gross margin is roughly -72%, and net margins are even worse, deep in triple‑negative territory. That means OLOX is losing money on every dollar of sales.
On the balance sheet, Olenox Industries Inc. lists about $64.2M in total assets, including significant goodwill and intangibles, against $44.8M in total liabilities. Equity looks positive at roughly $19.4M, yet the quality of that equity matters. OLOX has only about $1.2M in cash versus more than $9.4M in current debt and over $14.5M in accounts payable. Working capital is a steep negative, around -$22.9M, and the current ratio near 0.1 shows tight liquidity.
More Breaking News
Valuation screens cheap at first glance. OLOX trades at about 0.37 times sales and only 0.08 times book value. But traders need to weigh that “cheap” look against heavy losses, negative cash flow per share, and high leverage with total debt-to-equity around 1.36. For OLOX, the story is less about current earnings power and more about survival and potential turnaround.
Why Traders Are Watching OLOX Price Swings
The chart tells you why short-term traders keep circling OLOX. Just days ago, Olenox Industries Inc. spiked from the $0.80 area to an intraday high near $1.86 before slamming back to close at $1.25. Moves like that are a magnet for momentum and scalping strategies. Since that spike, OLOX has bled lower, with daily closes sliding from just under $1.00 down into the $0.70s. That’s a sharp pullback, but it also defines clear support and resistance levels that many day traders rely on.
Intraday, the 5‑minute chart for OLOX looks like a rollercoaster. Pre‑market and early trading show price lifting from roughly $0.75 up into the $1.20s, then failing and grinding back near $1.05. Those repeated pushes above $1.10, followed by quick rejections, hint at overhead supply and possible profit‑taking by early longs. At the same time, the strong bounce from sub‑$0.80 shows dip buyers are active.
For active traders, OLOX is the type of low‑priced, high‑range ticker that can produce fast gains and equally fast losses. Olenox Industries Inc. has a tiny share count, weak fundamentals, and intense volatility — a classic small‑cap recipe. Some traders will look to fade spikes into prior resistance near $1.20–$1.30, while others will watch the $0.70–$0.75 zone as a key level where OLOX has recently found support. Volume and range make OLOX a watchlist regular for momentum‑driven strategies.
Conclusion
Olenox Industries Inc. is not a “safe” story stock — it’s a broken fundamental picture wrapped in a volatile chart. Revenues are small, margins are deeply negative, and OLOX is burning cash. The balance sheet shows heavy debt, thin cash, and negative working capital, which together put pressure on management to either raise capital, cut costs, or grow revenue fast. None of that is guaranteed, and traders need to respect that OLOX sits in high‑risk territory.
At the same time, that very weakness is what draws many short‑term traders. OLOX trades at low multiples of sales and book value, bounces hard intraday, and offers clean levels for technical setups. Olenox Industries Inc. has shown that a single session can deliver a 50–100% swing from low to high. That is opportunity for disciplined traders and a trap for anyone who overstays or ignores risk.
The key with OLOX is to treat it as a trading vehicle, not a comfort blanket. Tight risk management, clear plans, and respect for liquidity are non‑negotiable. As millionaire penny stock trader and teacher Tim Sykes, says, “It’s not about how much money you make; it’s about how much money you keep.”. Tim Sykes likes to remind traders, “The key to long‑term success as a trader is preserving your capital and minimizing drawdowns.” OLOX is a textbook place to apply that mindset — study the chart, know the fundamentals, and always be ready to cut losses fast. This coverage of OLOX is for educational and research purposes only, and every trader must make their own decisions.
This is stock news, not investment advice. Timothy Sykes News delivers real-time stock market news focused on key catalysts driving short-term price movements. Our content is tailored for active traders and investors seeking to capitalize on rapid price fluctuations, particularly in volatile sectors like penny stocks. Readers come to us for detailed coverage on earnings reports, mergers, FDA approvals, new contracts, and unusual trading volumes that can trigger significant short-term price action. Some users utilize our news to explain sudden stock movements, while others rely on it for diligent research into potential investment opportunities.
Dive deeper into the world of trading with Timothy Sykes, renowned for his expertise in penny stocks. Explore his top picks and discover the strategies that have propelled him to success with these articles:
- Penny Stocks Trading Guide
- Best Penny Stocks Under $1 to Buy Today
- Top 8 Penny Stocks to Watch on Robinhood
Once you’ve got some stocks on watch, elevate your trading game with StocksToTrade the ultimate platform for traders. With specialized tools for swing and day trading, StocksToTrade will guide you through the market’s twists and turns.
Dig into StocksToTrade’s watchlists here:





Leave a reply