

Fermi Inc. faces heightened selling pressure after a critical product recall, and its stocks have been trading down by -6.04 percent.
Key Takeaways
- FRMI has sold off from the $5s to low $3s in recent weeks, signaling a clear shift in momentum.
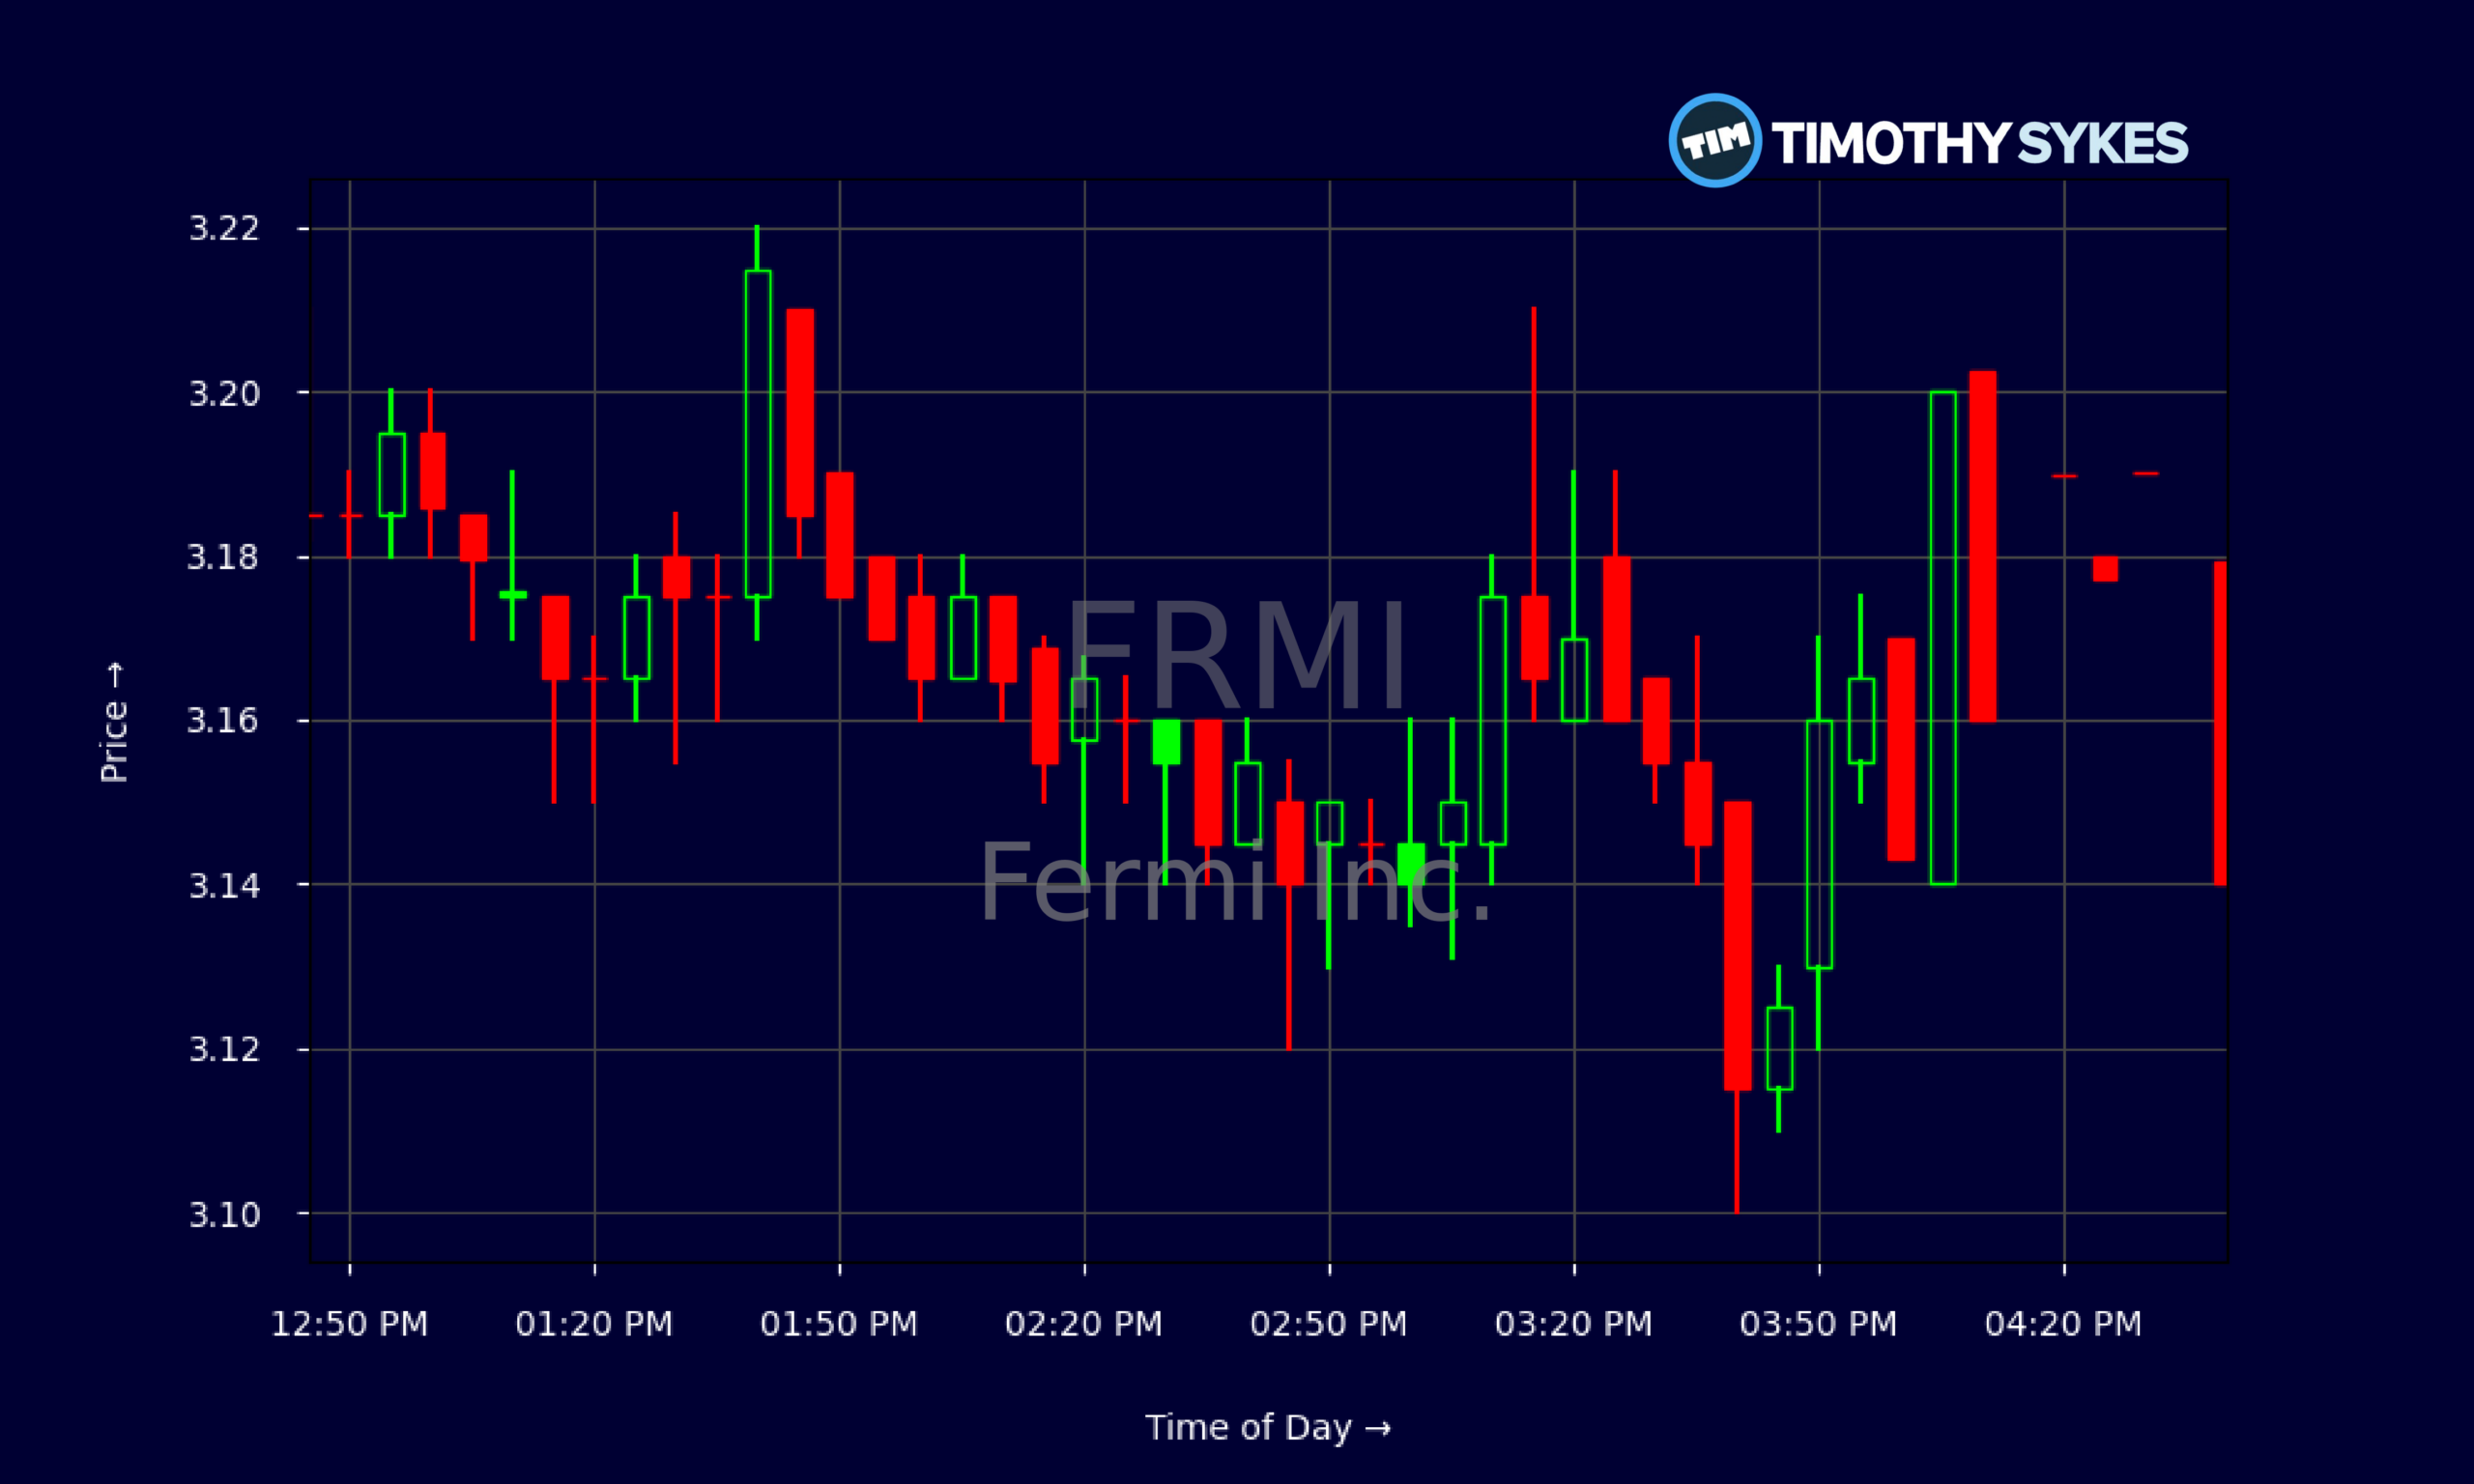
- Intraday trading shows Fermi Inc. chopping in a tight $3.10–$3.20 band, hinting at short-term consolidation.
- Cash flow data reveals heavy negative free cash flow and large capital spending, putting the spotlight on liquidity.
- Fermi Inc. carries meaningful debt with a weak current ratio, making any further downside in FRMI more meaningful for risk management.
Live Update At 16:46:41 EDT: On Friday, October 16, 2026 Fermi Inc. stock [NASDAQ: FRMI] is trending down by -6.04%! Discover the key drivers behind this movement as well as our expert analysis in the detailed breakdown below.
Quick Financial Overview
FRMI is trading like a name under pressure. Just a few weeks ago, Fermi Inc. was changing hands above $5. Now FRMI is closing near $3.16, a drop of roughly 35–40%. That is a real trend, not noise. For traders, this kind of slide often tells you funds are quietly exiting while day traders try to scalp the volatility.
On the fundamentals side, FRMI is not throwing off cash. Fermi Inc. reported a quarterly net loss of about $25.8M and negative operating cash flow of roughly $48.7M. Free cash flow was even worse at about -$233.6M once you include around $185M in capital spending. That is aggressive spending paired with heavy cash burn.
More Breaking News
The balance sheet shows total assets of about $1.76B and equity near $1.03B, but the current ratio sits around 0.3. That tells you FRMI has relatively few liquid assets compared with near-term obligations. With total debt around $520M and return on assets deeply negative, traders watching Fermi Inc. need to treat this as a speculative, story-driven chart rather than a stable cash machine.
Why Traders Are Watching FRMI Price Action
The daily chart of FRMI reads like a lesson in trend breaks. Fermi Inc. traded above $5 around late September, then started stair-stepping lower: $4.80s, then $4.50s, then the low $4s, and finally this week’s flush into the low $3s. Every bounce has been sold. For short-term traders, that is classic “fade the rip” behavior.
Look at the recent range. FRMI closed around $5.14 on 2026/09/22, then $5.06 the next day. From there, Fermi Inc. rolled to the mid-$4s, then high $3s, and now $3.16 on 2026/10/16. The key area now is the $3.00–$3.10 zone. If FRMI loses that range on volume, momentum shorts may press it further. If it holds and builds higher lows, you could see a snapback toward $3.50–$3.70 as shorts lock in gains.
Intraday, FRMI spent most of the day grinding sideways between about $3.14 and $3.21 after an early dip from the $3.30s. That tight band tells traders there is a tug-of-war between dip buyers and continued selling. For active scalpers, Fermi Inc. is offering small, repeatable moves rather than huge breakouts.
Overlay the fundamentals and the picture is clearer. FRMI has negative returns on assets and equity, plus rising debt. Any headline about funding, dilution, or asset sales would matter instantly. Until then, many traders will treat Fermi Inc. as a technical trading vehicle — fading spikes, shorting failed bounces, and cutting losses fast.
Conclusion
FRMI sits at an important spot on the chart and on the balance sheet. Fermi Inc. has real assets and a sizable equity base, but also negative free cash flow, a thin liquidity cushion, and a price that has been trending straight down for weeks. That mix attracts active traders but raises clear questions about long-term durability.
From a trading perspective, the game plan is straightforward. FRMI is in a downtrend; respect that first. For Fermi Inc. to flip the script, you want to see higher lows hold above $3, strong volume on green days, and clear confirmation that the worst of the selling is done. Until that happens, every push toward prior resistance in the $3.50–$4 range is a potential short or quick flip zone for disciplined traders.
Risk management is everything here. FRMI’s low current ratio and ongoing losses mean any surprise dilution, refinancing, or guidance shift can move Fermi Inc. fast. That can reward prepared traders and punish anyone stubborn. As Tim Sykes likes to say, “Cut losses quickly — the market doesn’t care about your hope.” As millionaire penny stock trader and teacher Tim Sykes, says, “It’s better to go home at zero than to go home in the red.”. With FRMI, that mindset is not optional; it is survival. This breakdown is for educational and research purposes only, helping traders study the setup, not telling anyone what to do with their money.
This is stock news, not investment advice. Timothy Sykes News delivers real-time stock market news focused on key catalysts driving short-term price movements. Our content is tailored for active traders and investors seeking to capitalize on rapid price fluctuations, particularly in volatile sectors like penny stocks. Readers come to us for detailed coverage on earnings reports, mergers, FDA approvals, new contracts, and unusual trading volumes that can trigger significant short-term price action. Some users utilize our news to explain sudden stock movements, while others rely on it for diligent research into potential investment opportunities.
Dive deeper into the world of trading with Timothy Sykes, renowned for his expertise in penny stocks. Explore his top picks and discover the strategies that have propelled him to success with these articles:
- Penny Stocks Trading Guide
- Best Penny Stocks Under $1 to Buy Today
- Top 8 Penny Stocks to Watch on Robinhood
Once you’ve got some stocks on watch, elevate your trading game with StocksToTrade the ultimate platform for traders. With specialized tools for swing and day trading, StocksToTrade will guide you through the market’s twists and turns.
Dig into StocksToTrade’s watchlists here:





Leave a reply