

Chord Energy Corporation stocks have been trading up by 4.2 percent following upbeat analyst upgrades and stronger production outlook.
What Traders Need To Know
- Morgan Stanley lifted its Chord Energy price target to $178, tying the bullish call to oil near $100 and upcoming 2027 strategy details with Q3 results.
- Truist boosted its target to $195, flagging strong expected Q3 execution, better Waha gas pricing, and firm crude realizations with disciplined volume growth.
- Scotiabank launched coverage at Outperform with a $192 target, putting CHRD among favored U.S. E&Ps for free cash flow and valuation.
- UBS now targets $193 and sees 4‑mile laterals driving another beat‑and‑raise Q3, plus potential 2027 buybacks near 10% of market cap.
- The 2025 Sustainability Report shows lower methane and greenhouse gas intensity and strong safety, adding an ESG tailwind to the CHRD story.
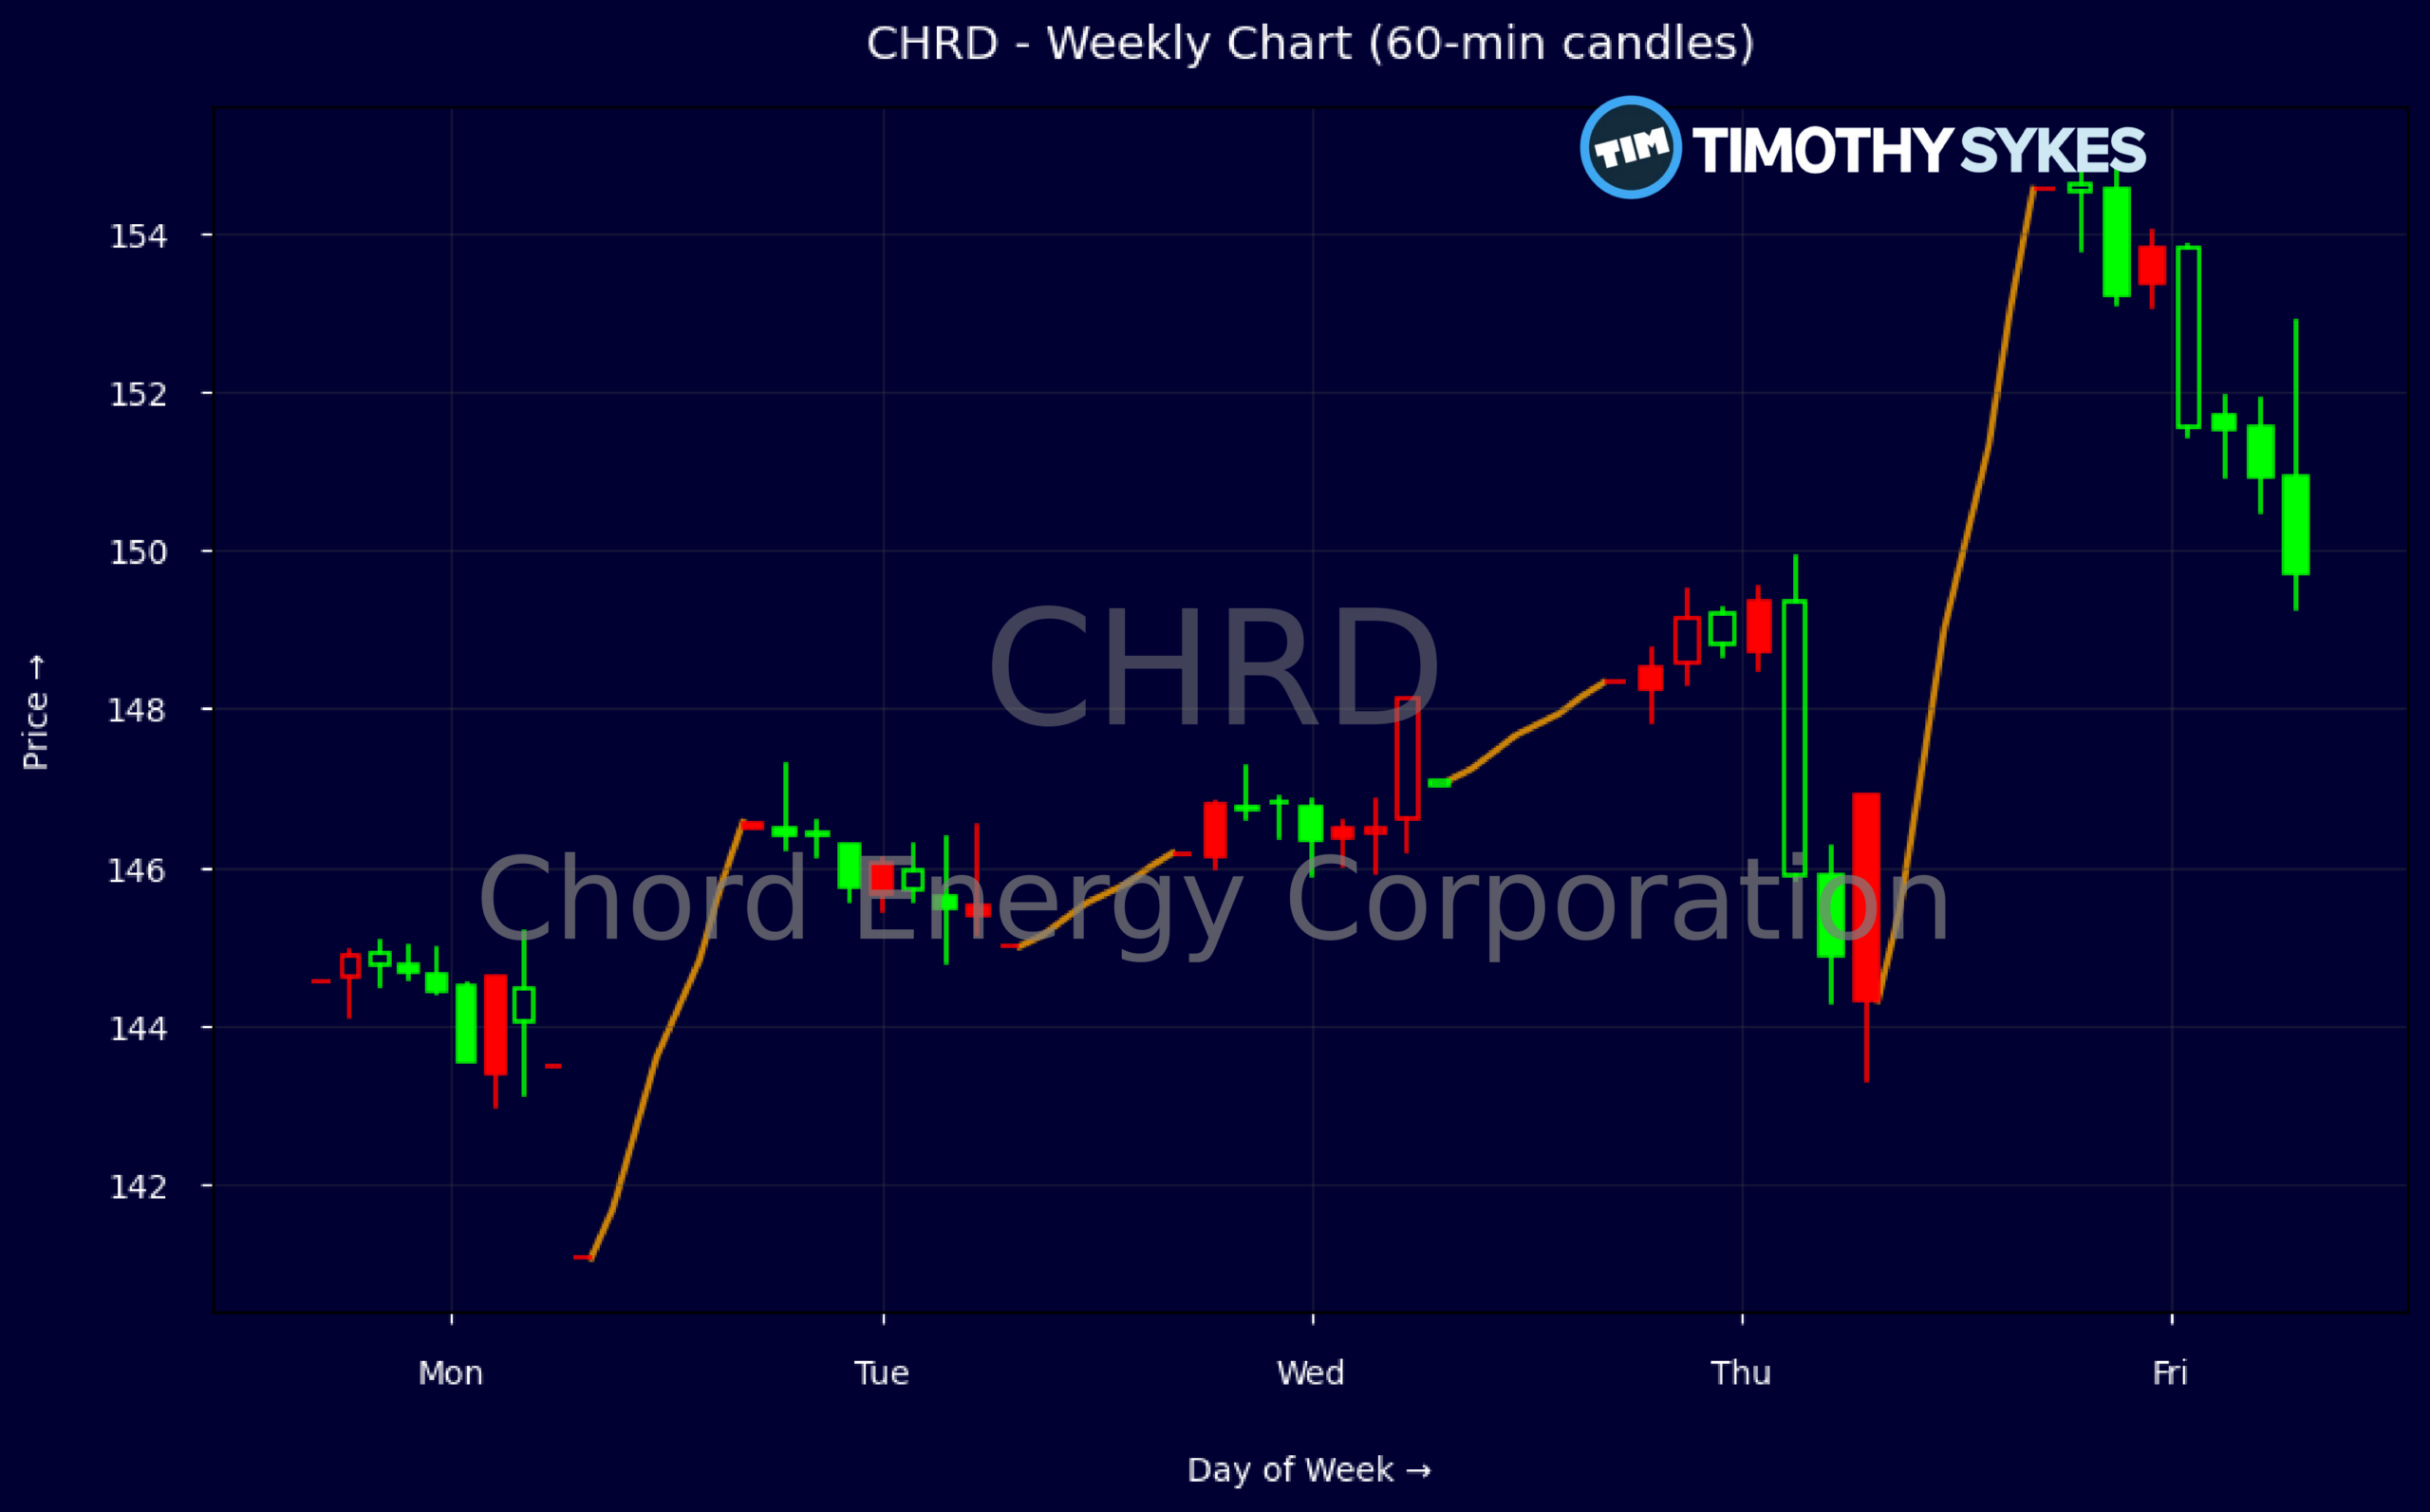
Weekly Update Oct 12 – Oct 16, 2026: On Friday, October 16, 2026 Chord Energy Corporation stock [NASDAQ: CHRD] is trending up by 4.2%! Discover the key drivers behind this movement as well as our expert analysis in the detailed breakdown below.
Energy industry expert:
Analyst sentiment – positive
Chord Energy sits in the top tier of US independents on both profitability and balance sheet quality. EBITDA margin above 40% and ROE in the mid-teens underscore efficient development of a high‑quality asset base, while sub‑0.2x debt‑to‑equity and interest coverage above 25x give significant resilience through cycles. Shares trade at under 1x book and ~1.2x sales with a P/E below 10 and price‑to‑FCF under 3x, an attractive discount versus E&P peers. Robust free cash flow and a ~3.5% cash dividend support a compelling total‑return profile.
Weekly price data show a strong, accelerating uptrend from roughly $145 to $155, with a series of higher highs and higher lows and no meaningful intraday rejection, confirmed by firm volume on up days in recent 5‑minute candles. The dominant trend is bullish, with momentum building above prior congestion near $148. For active traders, $148–150 now represents key support and a logical stop zone, while $155 is the immediate pivot; a sustained break above $155 opens room toward the high $160s.
Near‑term catalysts are overwhelmingly constructive: multiple bulge‑bracket upgrades with targets clustered around $178–195, support from oil near $100, improved Waha gas pricing, and expected Q3 outperformance on volumes and EBITDA. UBS sees capacity to retire nearly 10% of market cap by 2027 while keeping a sizable cash buffer, which compares favorably with broader energy benchmarks on free‑cash‑flow yield and capital discipline. I assign a decisive Overweight view with a 6–12 month target band of $180–190, with strong support at $148 and secondary support at $140.
More Breaking News
Quick Financial Overview
Chord Energy Corporation is trading around $154.56 after a string of analyst upgrades, up from the mid‑$140s earlier in the recent weekly data. That weekly climb from $144.57 to $154.56 shows steady, controlled upside rather than a blow‑off spike, which often signals more durable trend strength. For short‑term traders, this kind of staircase move, backed by fresh catalysts, can offer clearer risk levels than a vertical squeeze.
Intraday, CHRD’s 5‑minute chart shows tight action between roughly $151 and $155, with closes near the top of the day’s range. Dips toward the low $151s were repeatedly bought, while late‑day trade held above $154, suggesting active support under the current price. That intraday demand zone matters for day traders reading tape around upgrades and Q3 expectations.
On the fundamentals, Chord Energy Corporation posted about $4.88B in annual revenue, with strong EBITDA margin near 42.8% and gross margin around 45.4%. Valuation looks lean for an E&P name: a P/E near 9.45, price‑to‑sales around 1.23, and price‑to‑free‑cash near 2.7. Balance‑sheet risk looks contained with total debt‑to‑equity near 0.18 and interest coverage around 27.4, while dividend yield sits near 3.5% on a roughly $5.2 payout, backed by over $700M of quarterly free cash flow.
Conclusion
This is stock news, not investment advice. Timothy Sykes News delivers real-time stock market news focused on key catalysts driving short-term price movements. Our content is tailored for active traders and investors seeking to capitalize on rapid price fluctuations, particularly in volatile sectors like penny stocks. Readers come to us for detailed coverage on earnings reports, mergers, FDA approvals, new contracts, and unusual trading volumes that can trigger significant short-term price action. Some users utilize our news to explain sudden stock movements, while others rely on it for diligent research into potential investment opportunities.
Dive deeper into the world of trading with Timothy Sykes, renowned for his expertise in penny stocks. Explore his top picks and discover the strategies that have propelled him to success with these articles:
- Penny Stocks Trading Guide
- Best Penny Stocks Under $1 to Buy Today
- Top 8 Penny Stocks to Watch on Robinhood
Once you’ve got some stocks on watch, elevate your trading game with StocksToTrade the ultimate platform for traders. With specialized tools for swing and day trading, StocksToTrade will guide you through the market’s twists and turns.
Dig into StocksToTrade’s watchlists here:





Leave a reply