

Alpha Modus Holdings Inc. stocks have been trading down by -15.47 percent amid heightened concern over its latest financial performance.
Key Takeaways
- Shares of AMOD ripped from the low $1s to an intraday high near $4.77, signaling aggressive momentum trading.
- Daily charts show AMOD more than doubling in one session, with wide ranges that reward discipline but punish hesitation.
- Financials reveal minimal revenue, heavy losses, and negative equity, making Alpha Modus Holdings Inc. a high‑risk, story-driven ticker.
- Tight liquidity, low current ratio, and large short-term debt mean AMOD depends heavily on market access and financing.

Live Update At 07:48:44 EDT: On Monday, October 05, 2026 Alpha Modus Holdings Inc. stock [NASDAQ: AMOD] is trending down by -15.47%! Discover the key drivers behind this movement as well as our expert analysis in the detailed breakdown below.
Quick Financial Overview
Alpha Modus Holdings Inc., trading under ticker AMOD, is not a fundamental safety play. It is a pure speculation vehicle right now. The latest quarterly report shows revenue of only about $7,138, which is tiny for any listed company. At the same time, AMOD posted a net loss of roughly $2.15M and negative free cash flow near $0.9M. That tells traders the core business is still in heavy build‑out mode.
The balance sheet for AMOD shows cash of about $2.0M against current liabilities of roughly $9.5M. With a current ratio around 0.3 and a quick ratio near 0.2, Alpha Modus Holdings Inc. does not have much cushion. Working capital is deeply negative. Return on assets is extremely negative as well, signaling that every dollar tied up in the business is not paying off yet.
More Breaking News
For short-term traders, these numbers do not matter the way they do for long‑term holders. What matters is that AMOD is early stage, capital hungry, and dependent on financing. That combination often fuels sharp spikes when volume pours in, because many market participants are simply trading the chart, not the income statement.
Why Traders Are Watching AMOD Price Action
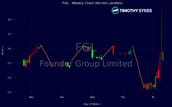
AMOD has become a textbook low‑float momentum play on the chart. Over several sessions, Alpha Modus Holdings Inc. traded in a tight band between roughly $1.55 and $2.24. That period looked like quiet consolidation. Then, on 2026/10/01, AMOD closed around $1.17 after fading from $1.88. Many would have written it off as just another failed pop.
The next trading day flipped that script. On 2026/10/02, AMOD opened near $3.48, spiked to $4.77, dipped to $3.08, and closed around $3.49. That is an enormous range, more than double the prior close, with intraday swings that could wipe out anyone trading without a plan. This is exactly the kind of volatility day traders in the Tim Sykes community hunt for.
Zoom into the intraday data and you see clear waves of emotion. Early action around $3.20–$3.30 gave way to a shove up toward $3.50 at 04:00, then repeated tests in the low $3s throughout the morning. The tape shows AMOD repeatedly bouncing near $3.05–$3.15 and rejecting pushes above the mid‑$3s. That creates obvious intraday levels for traders to lean on.
Because Alpha Modus Holdings Inc. has weak fundamentals and a stretched balance sheet, longer‑term confidence is thin. That actually amplifies trading opportunities. When volume floods in, shorts get trapped, longs chase, and every tick gets exaggerated. AMOD becomes less about what the company is worth and more about who controls the next candle. For active traders, that’s the whole game.
Conclusion
AMOD is a classic trader’s battlefield: ugly fundamentals, tiny revenue, and aggressive losses paired with explosive price swings. Alpha Modus Holdings Inc. shows only about $2.0M in cash against more than $6.2M in current debt and roughly $9.5M in total liabilities. That financial pressure means dilution and financing risk stay on the table, which many longer‑term market participants hate. But short‑term traders often love exactly that mix.
On the chart, AMOD has proven it can go from the $1s to nearly $5 in a blink. That tells every active trader the same thing: this ticker rewards speed, preparation, and strict risk control. Key intraday zones around $3.00 support and the $3.50–$3.80 resistance band will matter as long as volume remains elevated. If those levels break with size, Alpha Modus Holdings Inc. can offer more high‑probability day trades, both long and short.
The lesson around AMOD is bigger than one ticker. As Tim Sykes loves to say, “The market doesn’t care about your opinion, it cares about your discipline.” As millionaire penny stock trader and teacher Tim Sykes, says, “Small gains add up over time; focus on building wealth gradually, not chasing jackpots.”. For educational and research purposes, AMOD is a live example of that mindset. Traders who respect the volatility, study the price action, and cut losses fast can treat Alpha Modus Holdings Inc. as a real‑time training ground — not a long‑term promise, but a short‑term opportunity to sharpen their craft.
This is stock news, not investment advice. Timothy Sykes News delivers real-time stock market news focused on key catalysts driving short-term price movements. Our content is tailored for active traders and investors seeking to capitalize on rapid price fluctuations, particularly in volatile sectors like penny stocks. Readers come to us for detailed coverage on earnings reports, mergers, FDA approvals, new contracts, and unusual trading volumes that can trigger significant short-term price action. Some users utilize our news to explain sudden stock movements, while others rely on it for diligent research into potential investment opportunities.
Dive deeper into the world of trading with Timothy Sykes, renowned for his expertise in penny stocks. Explore his top picks and discover the strategies that have propelled him to success with these articles:
- Penny Stocks Trading Guide
- Best Penny Stocks Under $1 to Buy Today
- Top 8 Penny Stocks to Watch on Robinhood
Once you’ve got some stocks on watch, elevate your trading game with StocksToTrade the ultimate platform for traders. With specialized tools for swing and day trading, StocksToTrade will guide you through the market’s twists and turns.
Dig into StocksToTrade’s watchlists here:




Leave a reply