It sucks when your favorite trading strategy turns sour.
Everything can be going swimmingly…and then out of nowhere…BAM!
It stops working.
This happens a lot more often than you might think.
You see, many traders get complacent during bull markets, especially ones that last for a decade.
They forget that the trading environment can and will change.
And if you don’t adapt to the new conditions, you’re likely to get frustrated and start forcing trades.
The problem is not everyone knows how to calibrate to the new environment.
Thankfully, Karan Khanna has some words of wisdom for us.
Although he hasn’t hit that $1 million mark yet, Karan’s done well since joining my Millionaire Challenge in 2018, making over $250k.
However, he was closer to $300k at one point.
Yet, the strategies he relied on, mainly short-selling ideas from Tim Grittani, started to fail him in 2022.
Rather than keep pushing against a wall, Karan took a step back.
And that’s when his brilliant idea struck.

Speaking at our traders conference, Karan explained his process to break down the patterns and identify the underlying market structure.
I know that sounds confusing, so allow me to simplify things.
Because the genius in his method applies to ANY chart.
It can help you unstick your trading and get you back on track in no time.
4-Types of Market Structure
Market structure is a fancy way of saying market framework.
It’s like a pattern but distilled down to its most basic forms.
For example, a stock can only move one of three ways: up, down, or sideways.
Karan defines market structure in four ways:
- Rally→Consolidation→Rally
- Rally→Consolidation→Drop
- Drop→Consolidation→Drop
- Drop→Consolidation→Rally
This doesn’t encompass every single move a stock makes, but rather describes the forms it creates.
Understanding Its Purpose

Market structure helps to identify support and resistance levels as well as their importance.
You see, Karan looks for consolidation areas with heavy volume.
That’s where buyers and sellers fight it out.
Eventually, a stock moves out of the range.
However, that same area can act as support and resistance when revisited.
The key to identifying these spots is to think about the four types of market structure.
Here’s an example.
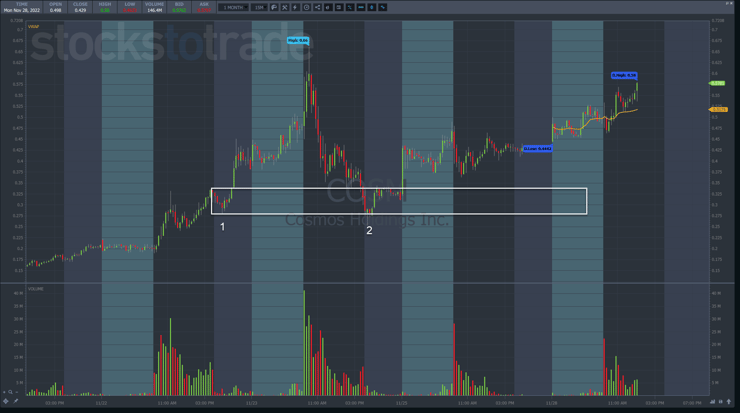
This is a 15-minute chart of Cosmos Holdings Inc. (NASDAQ: COSM).
Note: I would never short a stock below $1.00. This chart is just to demonstrate the point.
I drew a white box around the consolidation part of the market structure and then extended it to the right.
The reason I chose that specific area (1) is because it follows one of the basic market structures: rally→consolidation→rally.
You could argue that the spike earlier in the day was the consolidation, as it had more volume.
However, as Karan explained, market structure works when a stock leaves the consolidation in a quick, noticeable move.
So, knowing this is an important spot, it comes as no surprise the stock found support here the following day.
Here’s where the insight comes in.
Let’s say Karan at a short setup identified.
Before, he would simply play the short setup, ignoring the market structure.
Now, he considers where that market structure support or resistance levels exist and plans accordingly.
Once a stock breaks through important support, he’s got more confidence to push on the short side for lower prices.
It’s also worth noting that the more times a stock tests a support or resistance, the less likely it is to hold.
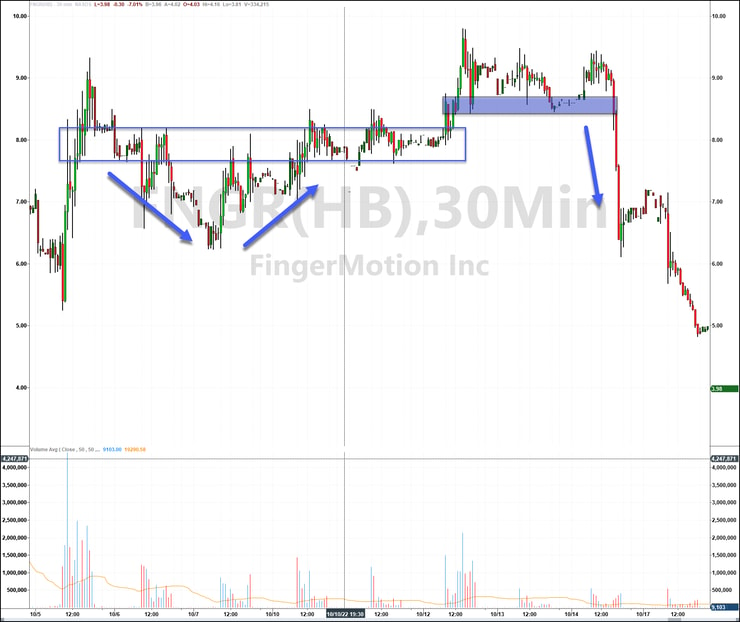
Here’s an example from FingerMotion Inc. (NASDAQ: FNGR).
I drew two boxes that I want to bring your attention to.
Let’s start off with the right blue filled box.
This identifies the last consolidation FNGR made before breaking out to new highs.
When it broke through that spot on volume, it signaled a nice short opportunity with a stop nearby.
But why wouldn’t the left box act as support?
Didn’t the stock consolidate there for a while?
It did and certainly could have acted as support.
However, I want to refer back to something I said earlier.
The more times a stock trades at and through a price level, the less important it becomes.
If the consolidation was tiger, then this might have been more important.
Yet, price traded above, below, back up to, and through that level on multiple occasions.
Think about it as if you were a long or short trader.
Would you still have a position after it bounced around so many times?
Probably not.
The choppiness tends to push most traders out.
Karan’s goal is to only use levels that trap longs or shorts as part of his analysis.
In a nutshell, all he wants is to take the same setups he normally plays and look at how close they are to important support and resistance points.
That’s it.
Finding those spots can take some practice.
But once you learn to incorporate them into your trading, it’ll make you even more effective.
—Tim


Leave a reply