Perfect First Green Day Setup: Key Takeaways
- OTC first green day plays are most consistent when three specific indicators line up.
- Two ‘PLUS’ indicators can make the play even better. (Even if one of the big three indicators isn’t ideal.)
- First green day overnight gap-ups happen when informational inefficiency meets FOMO.
- Keep reading to see how I traded the BILZF, VNTH, and CYBL first green day setups.
Trying To Grow A Small Account? Discover the Power of “FGD Fridays”
Table of Contents
What Is the OTC First Green Day Setup

2026 Millionaire Media, LLCIn this post, I’ll review three first green day trades. First, it’s important to understand how to identify a first green day. (The VNTH trade below goes deep into the difference between a first green day and a meaningful first green day.)
This is what I look for in an OTC first green day…
- Big percent gainer with volume. It should be up enough that scans pick it up.
- Holding gains. Going into the close it should be at, or near, the high of day (HOD).
- News catalyst. Some OTC first green days don’t have an obvious news catalyst. Keep reading to see how I treat them a little differently.
Using the above criteria, let’s review three trade examples. The first is a reminder that a great trade can come up at any time…
3 Examples of a First Green Day Setup
The first example goes back to September 2019. It was the last hour of trading at the 2019 T&I Summit when the perfect first green day setup forced my hand. At the time, it was one of my best trades in years.
Ignite International Brands Ltd (OTCQX: BILZF)
I was willing to not trade during the conference. Attendees seemed a little disappointed. But if there’s no perfect trade … there’s no perfect trade.
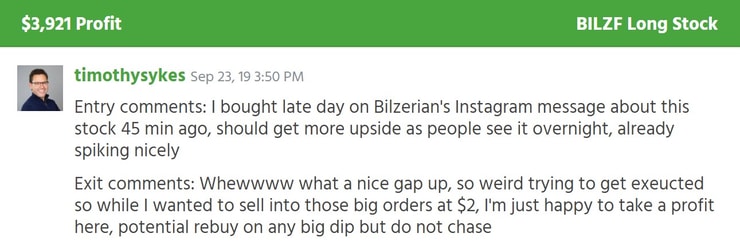
Then, in the last hour of the trading day, Dan Bilzerian posted on his Instagram story. The post said that his company’s stock was available on the U.S. market. And that created an informational inefficiency. Many people who wanted to invest were waiting. Until that day they didn’t know it was possible.
A Perfect First Green Day Setup
Take a look at the BILZF chart below. It shows a perfect OTC first green day setup for the overnight hold. Notice the huge morning spike, too. I underestimated how high it could go.
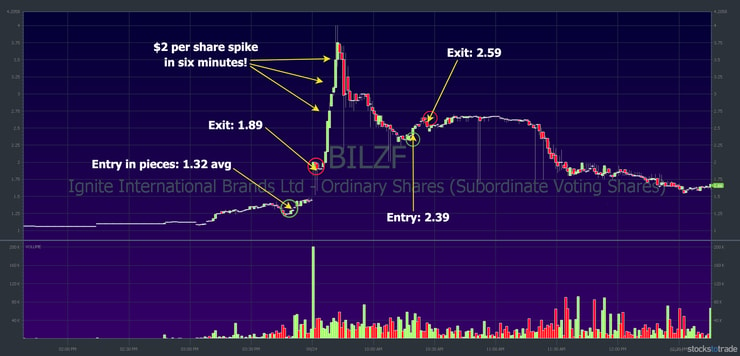
I made $3,921 on this OTC first green day play. (Starting stake: $9,240.) And I also made $1,042 on the dip buy. (Starting stake: $11,950.) The first trade turned out to be one of my best trades in years. It fit my indicators perfectly and went up another $2 per share after I sold.
A few things about this particular first green day trade…
Moving Pieces: Understand the Nuances of Individual Trades
Given the situation, the setup, and the price action, it was a good buying opportunity in the $1.20s or $1.30s. But there were a lot of moving pieces…
Fills were tough. I tried to buy in the $1.20s and managed to get filled at a $1.32 average. Then I ended up with a bigger position than I wanted. I’m pretty sure my order got executed right away but with delayed reporting.
Not knowing whether you’re in a trade can cause problems.
It was an afternoon dip buy of a strong first green day. That provided some protection in case I was wrong. There was support and a clear risk level in the range where I bought it.
As usual, I sold too soon but was happy with a 43% overnight win. Recognizing that it was a good opportunity was the best thing about the trade. And it was cool that everyone at the conference got to see it in real time.
Why I Love Penny Stocks
BILZF was a nice refresher about the potential for penny stocks. It’s also a reminder that focusing on ideal setups can help reduce frustration. Most traders face losing odds every day.
So focus on your perfect trading setups. Then rinse and repeat.
Here’s a more recent example of a first green day…
NanoMobile Healthcare Inc (OTCPK: VNTH)
VNTH had a perfect multiday breakout on October 13, 2021. It was a solid first green day OTC play so I bought a dip off the highs. Here’s the chart with my trade…
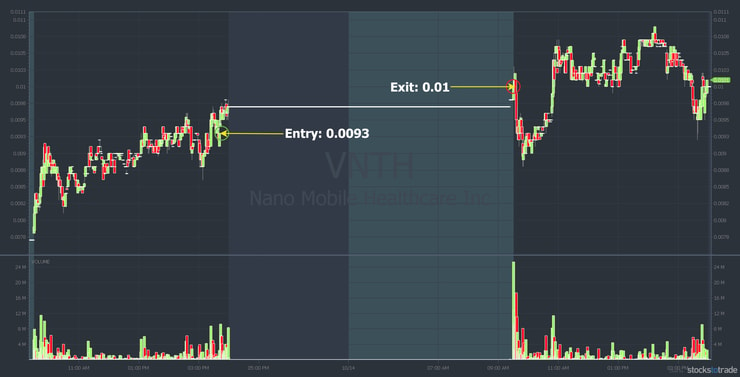
VNTH gapped up the next day and I sold for a solid $497 win on a very small position. (Starting stake: $6,680.)
A Trading Challenge student asked how VNTH was a first green day when it was the second green daily candle. Check it out…
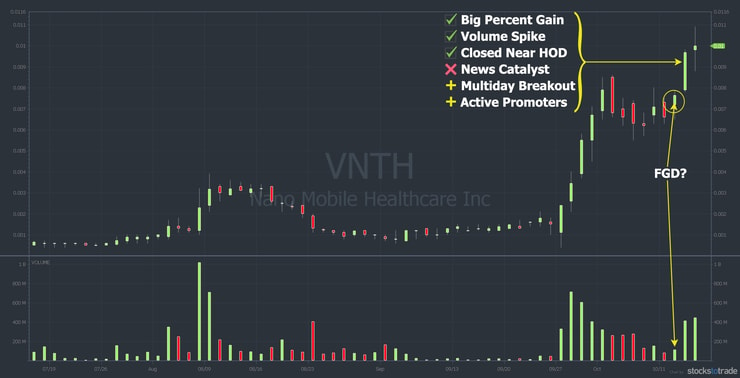
Was the circled day a first green day? It’s open for interpretation. Yes, the color of the candle is green. So, technically, the next day was a second green day.
But look at the volume. The questionable first green day had low volume. And it only finished up roughly 7% on the day.
On the meaningful first green day, VNTH had…
- A big percent gain — finishing up 23% on the day
- A big volume spike — more than double the previous day
- It closed near the HOD
- PLUS: a beautiful chart with a multiday breakout
- PLUS: heavy promoter activity (it was a big Twitter pump)
The only thing missing to make this a perfect first green day setup was a news catalyst. But promoters, press release rumors, and a multiday breakout outweighed the missing news.
Here’s another example of an almost perfect first green day setup…
More Breaking News
- Ardelyx Surges Following Analysts’ Bold Price Target Upgrades
- Canopy Growth Faces Challenges Amid Financial Struggles
- Crinetics Pharmaceuticals’ Stock Surges after Positive Trial Results and Analyst Boosts
- Bloom Energy Stock Jumps: A New Beginning?
Cyberlux Corp. (OTCPK: CYBL)
An October 6 company tweet started with “Quick update: The dots do connect.” That led to a strong first green day on October 7 for this former runner. Then, at 3:42 p.m. Eastern, Cyberlux teased acquisition news. As always, thanks to StocksToTrade Breaking News for alerting this tweet.
The stock started running and broke out over the earlier HOD. It was a little risky, but I took a position. My plan was to hold it overnight, but CYBL had a massive runup into the close. So I reduced my position size. Later that night, the company confirmed the acquisition.
Here’s my trade…
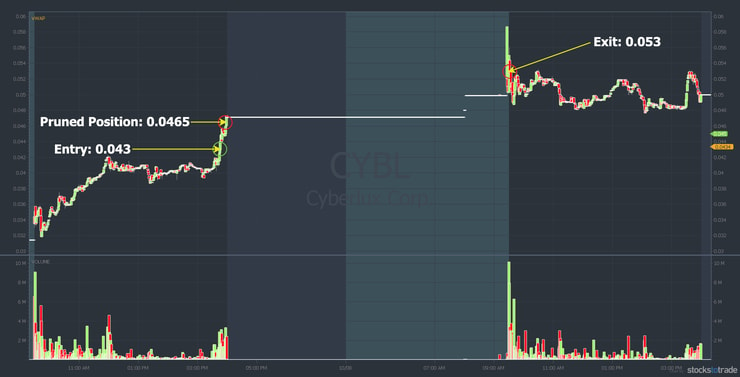
It was a beautiful gap-up for a $1,541 win. (Starting stake: $11,046.) To recap — CYBL’s first green day had…
- A big percent gain — it was up 25% when I bought and closed up 36%
- Upcoming news in the form of a self-promoting tweet
- It closed near the HOD
- After-hours confirmation of the news — again, that creates an informational inefficiency, and less meticulous traders place buy orders overnight
- PLUS: it had a clean intraday breakout
- PLUS: heavy promoter activity
It didn’t have a big volume spike. But it still traded 239 million shares on the day. And it was a perfect #5 from my 7-step pennystocking framework.
What Defines An OTC First Green Day

2026 Millionaire Media, LLCAgain, I like to see a big percent gain and big volume. Ideally, there’s a news catalyst. And I like to see the stock holding at, or near, its highs into the close. A multiday or multi-week breakout is a plus. Heavy promoter activity is also a plus in the current market.
Why OTC First Green Days Work
They don’t always work. But when they do, it’s because most people aren’t meticulous. They see the spike and news overnight and get encouraged to place buy orders at the open. The OTC first green day setup is about being early and recognizing that.
Final thoughts on this setup…
Learn the OTC First Green Day Setup
Trading random patterns leads to frustration. Inevitably people say, “Hey, I don’t wanna trade as much. I don’t wanna feel frustrated all the time.”
Focus on patterns that make sense. It’s not an exact science, but the OTC first green day setup happens based on specific indicators. Once you learn to recognize them, you put yourself in a position to trade them.
If you’re still under the PDT, the first green day pattern is one way to grow a small account. Holding overnight doesn’t use a day trade.
Want to learn how to recognize solid setups like an OTC first green day?
Apply For the Trading Challenge Today
The question is, will you learn from someone with experience and a track record, or learn the hard way? It’s your choice.
What do you think of the OTC FGD setup? Comment below, I love to hear from all my readers!




Leave a reply