People get this idea in their heads that trading penny stocks is high risk.
The way they talk about it, you’d think I mortgage my house on every trade.
The truth is successful penny stock traders find more consistency than most other styles, including buy and hold investors.
My style generated a 77% win rate over nearly 7,500 trades.
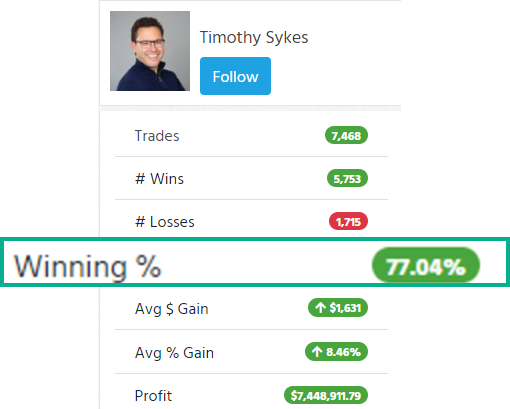
All my trades are posted for everyone to see right here
Students who join my millionaire challenge are amazed when they see this LIVE!
At first, it looks like magic when I pick off the bottom of a stock that’s dropped double-digit percentages from its highs.
But there’s a method to the madness.
You see, I don’t just look at one price or one indicator to select my entry, I use multiple data points to make my decision.
FaZe Holdings Inc. (NASDAQ: FAZE) is a great example.
Although I didn’t win the trade, the theory and analysis were correct.
Let me take you through the steps so you understand what I look for and how to apply to your own trades.
Important Prices

Every day, the market offers up support and resistance levels for anyone to use.
There are four every trader should mark on their charts:
- Close
- High
- Low
- Open
Of the four, the opening price is the least important but still reliable.
Do yourself a favor.
Whenever you analyze a chart, mark these prices for each day.
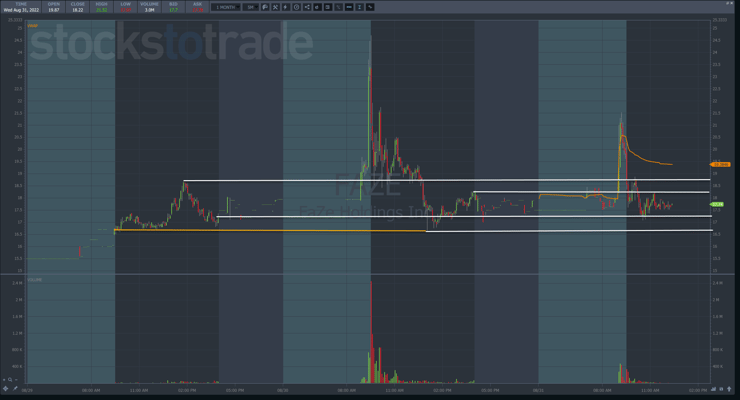
This is what it looks like for FAZE.
The orange line represents the open from the 29th. I gave that one a different color because it comes in at almost the same price as the low from the 30th.
Each of these levels CAN act as support or resistance.
It doesn’t mean that it will.
We’re identifying spots where the odds increase that a stock’s momentum will stop.
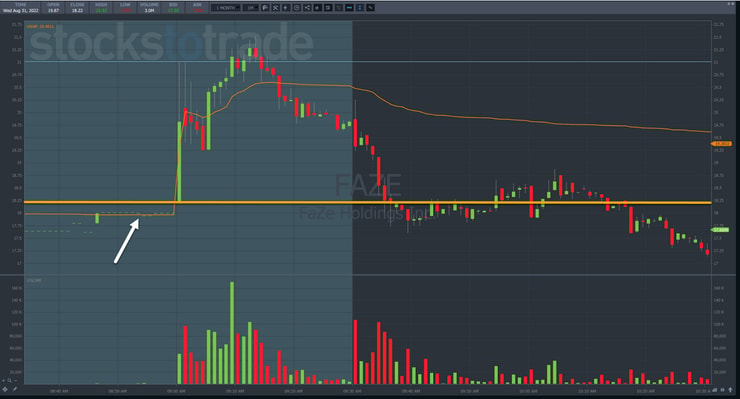
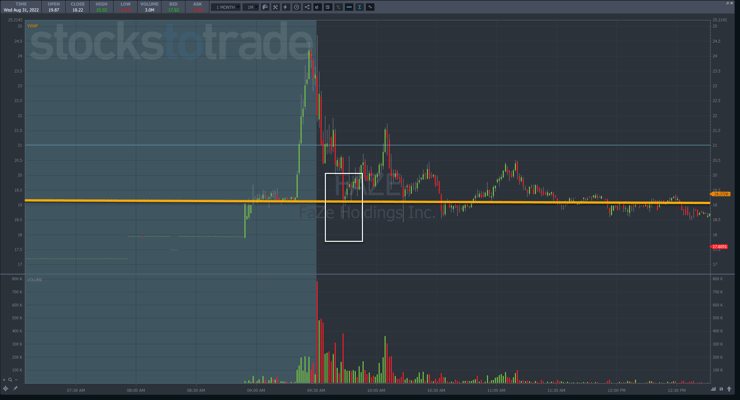
Now, let’s zoom in on the price action from the 31st.
The orange line represents the prior day’s close at $18.22.
I also drew a white arrow to the premarket trading right before shares exploded higher.
In and around that area should act as support when the stock dropped from $21.
If you wanted to be extra cautious, you could wait for a break of $18.00.
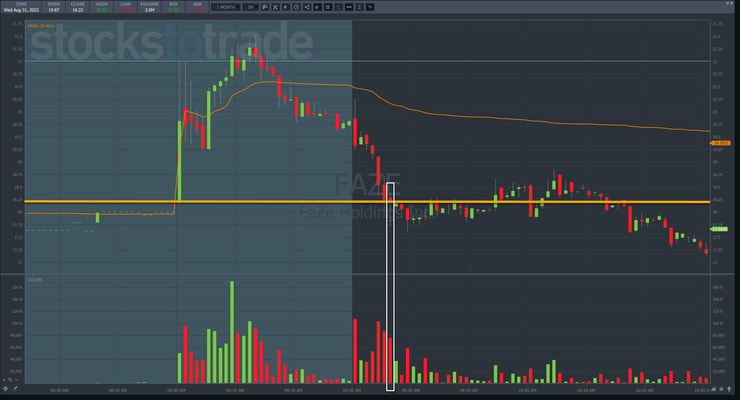
Now, take a look at the chart below and the candlestick in the white box.
Heavy volume combined with a long tail signals a potential bottom, especially at an important price.
This same phenomenon worked on the 30th against the high of $19.14 from the 11th.
Unfortunately, the bounce on the 31st wasn’t enough to really generate a profit. So, I stopped out at a small loss.
However, you can see how the exact same setup and concepts worked the day before.
Risk Management Is Crucial

Had I traded the bounce from the 30th, I would’ve made a nice 5%-10%.
With my trade on the 31st, I lost $0.10-$0.15 — small potatoes compared to the possible gains.
It’s why the very first thing out of my mouth during any training session is to keep losses small.
Some traders feel that means they stop out of trades too often.
That can happen.
But as my win rate shows, with practice, you’ll be able to improve your performance, get better entries, and know what to expect.
That way, when a stock fails to produce a bounce, as FAZE did on the 31st, you can feel confident taking a small loss.
Practice analyzing the charts and the price action around the four important prices.
Pay attention to how quickly and forcefully a stock hits these prices.
As we saw in FAZE, you should notice that the most violent reactions occur when a stock moves from further away on heavy volume.
Remember, this is just one of many patterns I teach. Each adds another tool to your belt.
Eventually, you’ll have enough to trade as often as you want and be confident in your trades.
—Tim

Leave a reply