If you’ve been following me for any length of time, you know I love to trade based on patterns.
Why?
Stock market patterns often repeat over and over again. It’s not an exact science, but it’s about as close to predictable as the stock market gets. The bull flag pattern and its variations are one of the most common and reliable.
Will the bull flag setup work 100% of the time? Of course not. But if you know what to look for, and how to gauge your entry and exit points, you can use bull flag trading to increase your chances of success. To learn strong entry and exit points and get involved in our trading community, apply for my Trading Challenge.
As always, I recommend you paper trade this pattern for a while before you trade with a live account.
Here’s everything you need to know about bull flag patterns, and three that you can start taking advantage of now …
Table of Contents
- 1 What Are Bull Flag Patterns?
- 2 Bull Flag vs Flat Top Breakout
- 3 Types of Bull Flags
- 4 How to Identify Bull Flag Pattern
- 5 How to Use the Bull Flag Pattern
- 6 Examples of Bullish Flags
- 7 3 Bull Flag Patterns That You Can Take Advantage Of
- 8 Key Tips to Find and Trade Bull Flag Patterns
- 9 What Happens if There is a Breakout?
- 10 The Bottom Line
What Are Bull Flag Patterns?

A bull flag is a powerful upward price movement (the flagstaff) followed by a period of consolidation (the flag). This trade setup assumes another breakout after the consolidation period.
The flag that forms during the consolidation period can look like a rectangle or a triangle (a pennant flag). I’ll show you some examples below.
It’s common for the flag to trend downward — against the trend — before the next upward push. However, there are flags with no downward direction. These are called flat top flags.
There’s a strategy that I lean on to trade bull flag patterns — day trading strategy. This strategy involves buying and selling stocks within a single trading day. It’s a fast-paced and potentially profitable approach to trading, but it requires a solid understanding of the stock market and careful risk management.
Read my day trading strategy guide here.
Psychology of Bull Flag Formation
The psychology behind flag patterns is important. There are a variety of reasons for the consolidation period. You need to understand them to take advantage of the next big price move.
Bull Flagpole — Long Plays and Short Covers
The bull flagpole forms when there’s a big upward movement in price. One of the most important concepts I teach my Trading Challenge students is to know the catalyst. The catalyst might be a press release or earnings release. It’s something that makes trading volume increase and drives big price movements.
Once the upward trend starts, traders taking a long position buy shares and the price continues to rise. At the same time, traders with a short position will often buy to cut their losses.
How the Bull Flag Forms — Profit Takers and More Short Covers
There are two main reasons for consolidation after a big upward move in price. The first is traders with long positions. The second is more short covers.
Traders who opened long positions on the initial breakout sell shares to lock in profits. They went ‘long’ expecting the stock price to rise. They’ve achieved their price goal and are cashing in. But to sell, someone has to buy, right?
Who will buy these now more expensive shares? Short sellers attempting to close their position because they’ve been caught in a short squeeze.
A short requires borrowing shares to sell. Then the trader repays the shares by purchasing at a lower price. But when the stock goes up, like in the bull flagpole, the squeezed short seller purchases shares at a higher price to cut their losses.
Keep in mind this back and forth goes on for a while — hence the consolidation. Also be aware the trading volume tends to drop during the flag or consolidation period as traders buy and sell within a small price range.
As you can see, there’s some psychology at play. Fear, jubilation, ego, and even a bit of greed underpins the pattern. Your job is to educate yourself so you see what’s happening and understand why — that’s how you take advantage of the pattern.
Differences Between Bull Flag and Bear Flag
In the stock market, the term bull means an upward trend. Bear refers to a downward trend. The difference between bull flags and bear flags is the prevailing trend and continuation after the flag forms.
Bull flags and bear flags are mirror images of each other on a chart. Bear flags form during a period of consolidation after a precipitous drop. Bear flags come in the same shapes as bull flags — rectangles, pennants, and flat bottom. The most common bear flag pattern has a slight upturn, or pull back.
Bull Flag vs Flat Top Breakout

Bull flags and flat top breakouts are both bullish indicators…
So what’s the difference?
Bull flags show lower highs on the chart. Flat top breakouts on the other hand show highs on the same level.
While they’re both signs of a potential uptrend, their characteristics are distinct.
More Breaking News
- Vizsla Silver Corp US Market Rift: Challenging Times Ahead
- Huntington Bancshares Misses Q4 Earnings Estimate Amid Turbulent Market Conditions
- Datadog Soars with Strategic Price Adjustments Amid Optimism
- RITR’s Strategic Moves Signal Potential Growth Amidst Market Challenges
Benefits of Trading Bull Flag Patterns
No pattern in the stock market is 100% reliable. Any pattern could resolve with false moves. But the bull flag pattern is one of the more reliable and effective trading patterns. When you start analyzing charts you will see this pattern over and over again.
Even though the three bull flag patterns described below look a little different on the charts, they mean the same thing. The psychology is the same. They behave the same way.
The main benefit of trading bull flag patterns is that they can be more reliable. As long as you time your entry points correctly and set a mental stop loss for your trade, you have a greater chance of taking advantage of this pattern. Will it happen the way you expect every time? No.
Another benefit is that bull flag patterns happen in multiple time frames. What do I mean by that?
If you search for information on how to trade bull flag patterns, you’ll notice there are differing definitions about what is and isn’t a true bull flag. One trader will tell you the flag is only a ‘real flag’ if it forms between five and 20 days. Another may say it takes three weeks.
Some might say it must pull back. Others say it could even be an upward flag or a flag blowing in the wind.
Know this: Every trading teacher skews their definition to fit their trading style so they can sell you their course. My point is, you can find bull flag patterns over different time frames and with different shapes.
You might see a classic bull flag pattern form and resolve within one trading session. Especially in penny stocks — my preferred stocks to trade. You might also see the patterns form over several days. Swing traders often take advantage of a multi-day bull flag patterns.
It’s possible to use this pattern regardless of your trading style, but be aware of the other factors involved in the price movement. Just because you see a huge price jump followed by a period of consolidation doesn’t mean it’s definitely going to spike again.
This is why I suggest you wait until the new breakout is clear. Be patient. Once the new breakout is confirmed, then you can make your play. Some people tell me I’m leaving money on the table getting in and out of trades conservatively. But I’ve learned those ego lessons the hard way.
I focus on a limited number of patterns. Here are three bull flag patterns I think you can use to your advantage.
Types of Bull Flags
Bull flags can come in a variety of forms, but they all share some basic characteristics. They form during a strong upward price rally (the flagpole), followed by a period of consolidation that downtrends (the flag). This pattern is seen in different investment areas and markets, including crypto and traditional stocks.
How to Identify Bull Flag Pattern

Identifying a Bull Flag pattern involves spotting a sharp price increase followed by a consolidation period. The initial uptrend (the flagpole) is usually characterized by heavy volume, while the consolidating flag tends to show decreasing volume. The support and resistance lines of the flag should run parallel to each other.
How to Use the Bull Flag Pattern
Traders use the Bull Flag pattern to predict continuation in an uptrend. After the price breaks above the upper resistance line of the flag, investors might consider opening long positions. It’s essential to use other indicators for confirmation and to manage risk effectively.
Another pattern you should know is the reversal. This strategy involves identifying when a trend is about to reverse and then trading accordingly. It can be a great way to take advantage of market volatility and make profits from both rising and falling markets.
Learn more about the reversal trading strategy in this article.
Examples of Bullish Flags
Real-world examples of Bullish Flags abound. Whether you’re looking at the stock market, the forex market, or the crypto market, Bull Flags appear regularly. They provide traders with potential opportunities to profit from the continuation of an existing uptrend.
Bullish Flag Emergence
The emergence of a Bullish Flag often follows a period of intense buying activity that forms the flagpole. Then, the market enters a consolidation phase forming the flag. It’s crucial to monitor volume during this pattern, as it can provide extra confirmation of the pattern’s validity.
Rectangular Bull Flag
A Rectangular Bull Flag is a specific type of Bull Flag where the consolidation phase takes a more rectangular shape. The price fluctuates between parallel support and resistance lines before a potential breakout.
Bull Flag Breakout
A Bull Flag Breakout occurs when the price moves above the upper resistance line of the flag, ideally on higher volume. This suggests that the buyers have regained control and that the uptrend may continue.
Tight Bull Flag
Tight Bull Flags are another variation of the Bull Flag pattern. The key characteristic of this pattern is the consolidation phase’s narrow range, implying a tight struggle between buyers and sellers.
3 Bull Flag Patterns That You Can Take Advantage Of
Before you can trade using any of the 3 bull flag patterns, you need to understand how to read a candle.
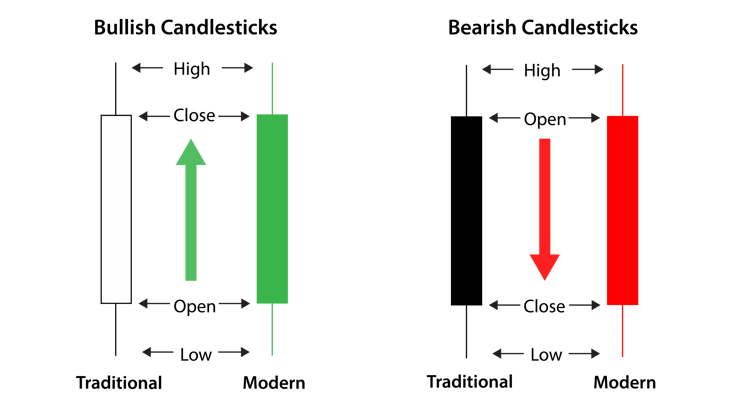
Candlestick charts were developed in 18th century Japan by a rice trader. They’re called candles because they look like a candle with a wick on both ends.
The main part of the candle — the body — represents the closing and opening prices for a given period. The ‘wick’ lines — called shadows in trading — represent the highest and lowest prices during the period.
Bullish candle formations are traditionally white or unfilled. These days you often see them as green on charts. Bullish candle formations signify the closing price was higher than the opening price.
Bearish candle formations signify the closing price was lower than the opening price. Bearish candles were traditionally black or filled-in. Modern charts often show them as red. Check out the graphic below for the basic idea.

One final consideration before we take a look at the patterns: You should know your entry and exit points before you make a trade based on these patterns. For that matter, you should keep a trading journal of every trade. I do — and I teach all my students to do the same.
1. The Flat Top Breakout Pattern
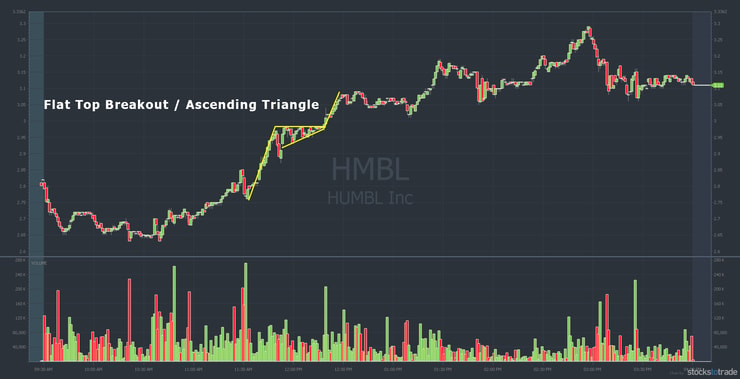
This is an awesome bull flag setup. In this pattern, there’s little or no pullback and no downward slope during the consolidation period. Instead, the consolidation has a flat top. The stock trades sideways as the flag forms.
Then, after the period of consolidation, the upward trend continues. Once the new breakout begins, it’s a good idea to wait for confirmation. It’s also a good idea to have a price target for getting out of your position.
The HMBL chart below is a great example of why you should wait for confirmation of the new breakout. The breakout was tested several times before it happened. In this case, the trading range narrowed in an ascending triangle.
Example of The Flat Top Breakout Pattern

There are varying opinions about the right exit point and I couldn’t cover every aspect of that in this article. But I will say this: know your exit point. When the stock price reaches your pre-determined exit point, close your position. Be happy with the small wins as you grow your trading skills!
Here’s one common formula: Take the price range of the first flagpole and add that to the price at the bottom of the flag. That gives you the new target price. As you look back at the chart above, notice the breakout is roughly the same height as the flagpole.
I haven’t used exact numbers for the above example. I want you to learn how to see it on the chart. But when you write down your trade setup you should have an exact entry and exit pre-determined.
Oh, and don’t go chasing the trade! If you miss your entry point because things are moving too fast, sit this one out. Also, don’t let your ego get the best of you if the stock is running up past your exit price. Develop self-discipline.
“But Tim,” you say, “what if I sell and the stock keeps going up beyond my exit point?”
Two things…
… First, be happy with small gains and take the win …
… Second, apply for my Trading Challenge. That way I can teach you what to do to take advantage of the situation.
2. The Descending Flag Pattern
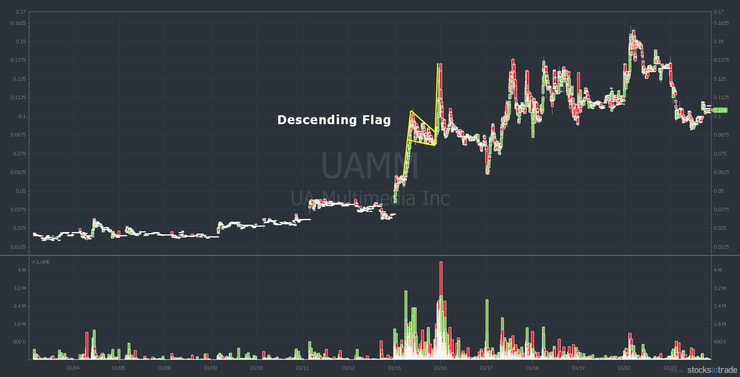
This is the classic bullish flag pattern and the one you’ll see the most. In this pattern, the consolidation period is a pullback so the flag descends. In the UAMM example below, the stock had a morning spike. Then it consolidated with lower highs over three hours, forming a descending flag. It finally broke out around 3 p.m. Eastern.
Example of The Descending Flag Pattern

3. The Pennant Flag Pole
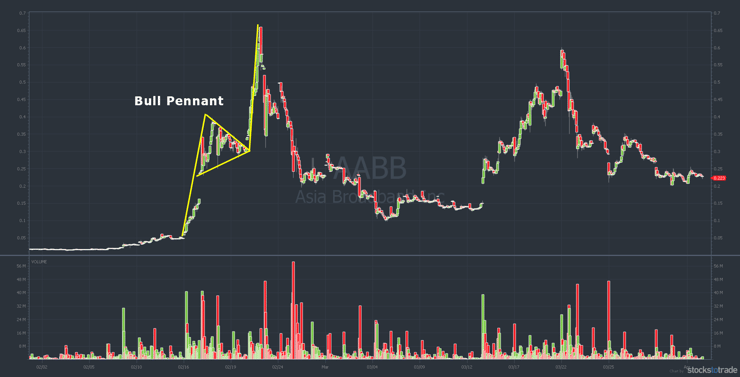
A bull pennant forms as the trading range narrows during the consolidation period. The result is a triangle shaped flag. The classic pennant shape appears to slope down from the top and up from the bottom. Occasionally you’ll see pennants with a flat top or flat bottom.
Check out the AABB chart below. It’s not perfect but you get the idea. The consolidation happens over three days and the trading range narrows along the way. It’s interesting to note that when you look at this in different time frames the pennant isn’t as obvious.
Example of The Pennant Flag Pole

Key Tips to Find and Trade Bull Flag Patterns
Learning to recognize a bull flag pattern on a chart is a skill you develop over time. The most important thing you could do today is look at some charts. If you don’t have a trading platform yet, try looking on a website like Yahoo Finance or BigCharts.
- Look for stocks with a surge in price related to high trading volume and a news catalyst …
- Then look for the period of consolidation …
- Finally, look for the price breakout above the consolidation along with increased trading volume.
Also, try different time frames when you look at the chart. Sometimes the bull flag is clear when looking at a 12-month daily chart. Other times it’s obvious when you look at a single day with five-minute candles.
If you’re serious about bull flag trading — and I think you should be — then use a trading platform with a bull flag pattern screener. It will look for all the right conditions based on news, trading volume, and price movements.
Bull Flag Pattern Technical Analysis Skills
You’ve heard me say it before: This isn’t an exact science.
Even in the examples above you can see there are variations. The key things to understand are the initial upward movement, the consolidation period, and the breakout. Now go look for this pattern on some charts! By looking for them you’ll start to notice how it works.
Use a Bull Flag Pattern Stock Screener
Before I brag on StocksToTrade — the trading platform I helped develop — let me tell you this isn’t for everyone. It’s for serious traders seeking success while taking advantage of what I think is the best modern trading platform on the planet.
StocksToTrade has screeners built right into the platform to help you find my favorite chart patterns. While it doesn’t scan specifically for bull flags, you can scan retracements. And that can help you find potential bull flag setups.
What’s a stock screener? It’s when you set the charting software to show only stocks that meet your specified criteria. The problem with doing it yourself is that most charting software is simply not set up to screen specific trading patterns.
Enter the totally badass trading platform for serious players: StocksToTrade. OK, enough bragging. Go check it out.
Only Trade Easy and Clear Patterns
One of the reasons I like bull flag patterns is because it’s clear and it’s easy. The psychology is fairly straightforward and you can set your entry and exit points based on what you see on the chart. You can set your mental stop loss easily.
I recommend you keep it simple at first. As you develop knowledge and skill, trading clear and easy patterns can become second nature. That’s what you’re going for.
Keep Improving Your Trading Knowledge

If you’re reading this article, I assume you’re serious about making money. Maybe you’re interested in generating five or six figures a year so you can enjoy the laptop lifestyle for the rest of your days. Or perhaps you’re committed to generating at least $1 million in profits from the stock market.
My students come from all walks of life, and each has individual goals. Everyone is working for something, though, and I teach my students to visualize their ideal lifestyle while they’re learning from me and other successful traders.
Furthermore, the challenge offers a community of like-minded people who help each other achieve their goals. It’s not just me in the trenches. When you know there are other people striving for the same things you want, you’ll have greater motivation to work hard.
If you want to create a different life for yourself, I invite you to apply for my Trading Challenge. I’m looking for my next success story, and you might become that person if you’re willing to put in the effort and become a successful trader.
In my Challenge, you’ll learn other strategies like gap trading strategy. This strategy involves trading stocks that have a price gap from the previous close to the current open. It’s a strategy that can offer significant profit potential, especially during volatile market conditions. To find out more about gap trading strategy, check out this guide.
What Happens if There is a Breakout?
A breakout from a bull flag pattern often results in a continuation of the previous uptrend. The strategy is that the height of the flagpole provides a target for the ensuing price movement.
The Bottom Line
The bull flag pattern is like a gift that keeps on giving. The bottom line? Human nature hasn’t changed a whole lot over the centuries. We have the same needs, wants and desires as our ancestors.
The bull flag pattern is built around human psychology. It’s not magic. It’s based on actions and reactions of traders. Once you see and understand the bull flag pattern, you can take advantage of it because human nature drives it.
Are you a trader who uses the bull flag pattern? Let me know in the comments below. If you’re just getting started, I want to hear from you, too!


Leave a reply