

QXO Inc. shares have been trading down by -3.34 percent after reports of delayed integration in its latest acquisition.
Key Takeaways
- Shares of QXO have faded from the mid-$13s to the high-$11s over recent sessions, signaling a short-term downtrend that active traders are tracking closely.
- Intraday, the stock shows tight, choppy trading around $11.70, hinting at short-term consolidation after the sharp morning gap down.
- The latest quarter shows QXO generating $3.246B in revenue but still posting a net loss of $55M, keeping the name in turnaround territory.
- QXO carries about $6.04B in long-term debt but offsets this with $5.774B in cash, giving the company significant financial runway despite ongoing losses.
- With negative margins but strong top-line growth, traders are watching whether QXO can transition from revenue story to profitability story.

Live Update At 15:02:13 EDT: On Tuesday, September 29, 2026 QXO Inc. stock [NYSE: QXO] is trending down by -3.34%! Discover the key drivers behind this movement as well as our expert analysis in the detailed breakdown below.
Quick Financial Overview
QXO is a classic high-revenue, low-profit story that momentum traders love to study. In the latest quarter, QXO brought in about $3.246B in total revenue. That’s serious scale. Yet the company still logged a net loss of roughly $55M, translating to about -$0.14 per share. So QXO is not a profit machine yet — it’s still in build‑out and rationalization mode.
Margins tell the same story. Gross margin sits around 24%, which is decent, but operating margin is negative and profit margins are firmly in the red. QXO reported EBITDA of about $235.8M, but EBIT and net income both slipped below zero, showing that interest and other costs weigh heavily on the bottom line.
More Breaking News
On the balance sheet, though, QXO looks stronger. Total assets are roughly $22.665B, with stockholders’ equity of about $10.378B. Cash and equivalents of about $2.774B, plus an ending cash position near $5.774B, give QXO real flexibility. Debt is sizable — about $6.04B in long‑term obligations — but leverage ratios and a current ratio above 4 show the company has room to maneuver while it works on profitability.
Why Traders Are Watching QXO Price Action
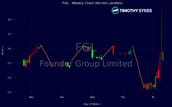
QXO’s chart is doing what smart traders notice first: trending, then stalling. Over the past few weeks, QXO drifted down from the $13.30–$13.60 range to Friday’s close near $11.72. That’s a meaningful pullback from recent highs and puts QXO firmly in a short-term downtrend on the daily chart. Each bounce — like the moves back above $12.40 and $12.70 earlier in the month — has been met with selling.
Zoom in to the intraday action and the picture sharpens. QXO opened Friday around $12.17, tried to push to $12.23, then failed hard and flushed into the low $11.70s in the first hour. After that morning shakeout, the stock spent most of the afternoon chopping between roughly $11.56 and $11.72. That kind of tight range after a selloff often signals consolidation, not yet a clear reversal.
For short-term traders, QXO sits at an interesting pivot. The $11.50–$11.60 zone is emerging as a support band, where dip buyers have stepped in several times intraday. On the upside, recent closes near $12.20–$12.40 now act as resistance. QXO needs to reclaim and hold that zone for any real trend change to stick.
Layer the fundamentals onto this chart and the setup becomes more nuanced. QXO is growing fast — revenue has surged almost 484% over the past three years — but profitability still lags. Negative returns on equity and assets, along with a price‑to‑sales ratio around 1.3, keep QXO in that “show me” phase. Traders focused on momentum will watch whether rising volume accompanies any break of these technical levels.
Conclusion
For active traders, QXO is a teaching chart in real time. The stock has strong revenue growth, a big balance sheet, and still‑negative earnings. That combination often creates volatile swings as different trading groups battle over the next narrative: growth winner or value trap. Right now, QXO sits in the middle of that tug-of-war, sliding off recent highs but stabilizing intraday.
Technically, the key questions are simple. Does QXO hold the $11.50 area on future dips? And can it convincingly reclaim the $12.20–$12.40 resistance band with volume? If QXO breaks down through support, trend traders will treat it as a continuation of the existing downtrend. If it powers back above recent resistance, short-covering and fresh momentum trading could push it higher in a hurry.
Fundamentally, QXO’s large cash position, sizeable debt load, and negative margins demand respect. This is not a “set it and forget it” story. It’s a name where traders need to track both the tape and the financial progress quarter by quarter.
As Tim Sykes likes to say, “Patterns repeat, but only disciplined traders benefit.” As millionaire penny stock trader and teacher Tim Sykes says, “Consistency is key in trading; don’t let emotions dictate your trades.” QXO is offering a clear pattern right now — a pullback, a consolidation zone, and obvious levels to watch. The edge goes to those who plan their trades, size properly, and cut losses fast while using QXO’s price action as a real‑world classroom, purely for educational and research purposes.
This is stock news, not investment advice. Timothy Sykes News delivers real-time stock market news focused on key catalysts driving short-term price movements. Our content is tailored for active traders and investors seeking to capitalize on rapid price fluctuations, particularly in volatile sectors like penny stocks. Readers come to us for detailed coverage on earnings reports, mergers, FDA approvals, new contracts, and unusual trading volumes that can trigger significant short-term price action. Some users utilize our news to explain sudden stock movements, while others rely on it for diligent research into potential investment opportunities.
Dive deeper into the world of trading with Timothy Sykes, renowned for his expertise in penny stocks. Explore his top picks and discover the strategies that have propelled him to success with these articles:
- Penny Stocks Trading Guide
- Best Penny Stocks Under $1 to Buy Today
- Top 8 Penny Stocks to Watch on Robinhood
Once you’ve got some stocks on watch, elevate your trading game with StocksToTrade the ultimate platform for traders. With specialized tools for swing and day trading, StocksToTrade will guide you through the market’s twists and turns.
Dig into StocksToTrade’s watchlists here:




Leave a reply