

Opendoor Technologies Inc stocks have been trading down by -4.04 percent amid bearish sentiment over housing market headwinds.
Key Takeaways
- Shares of Opendoor Technologies Inc have faded from early-October highs near $2.50, closing around $1.90 after a steady multi-week grind lower.
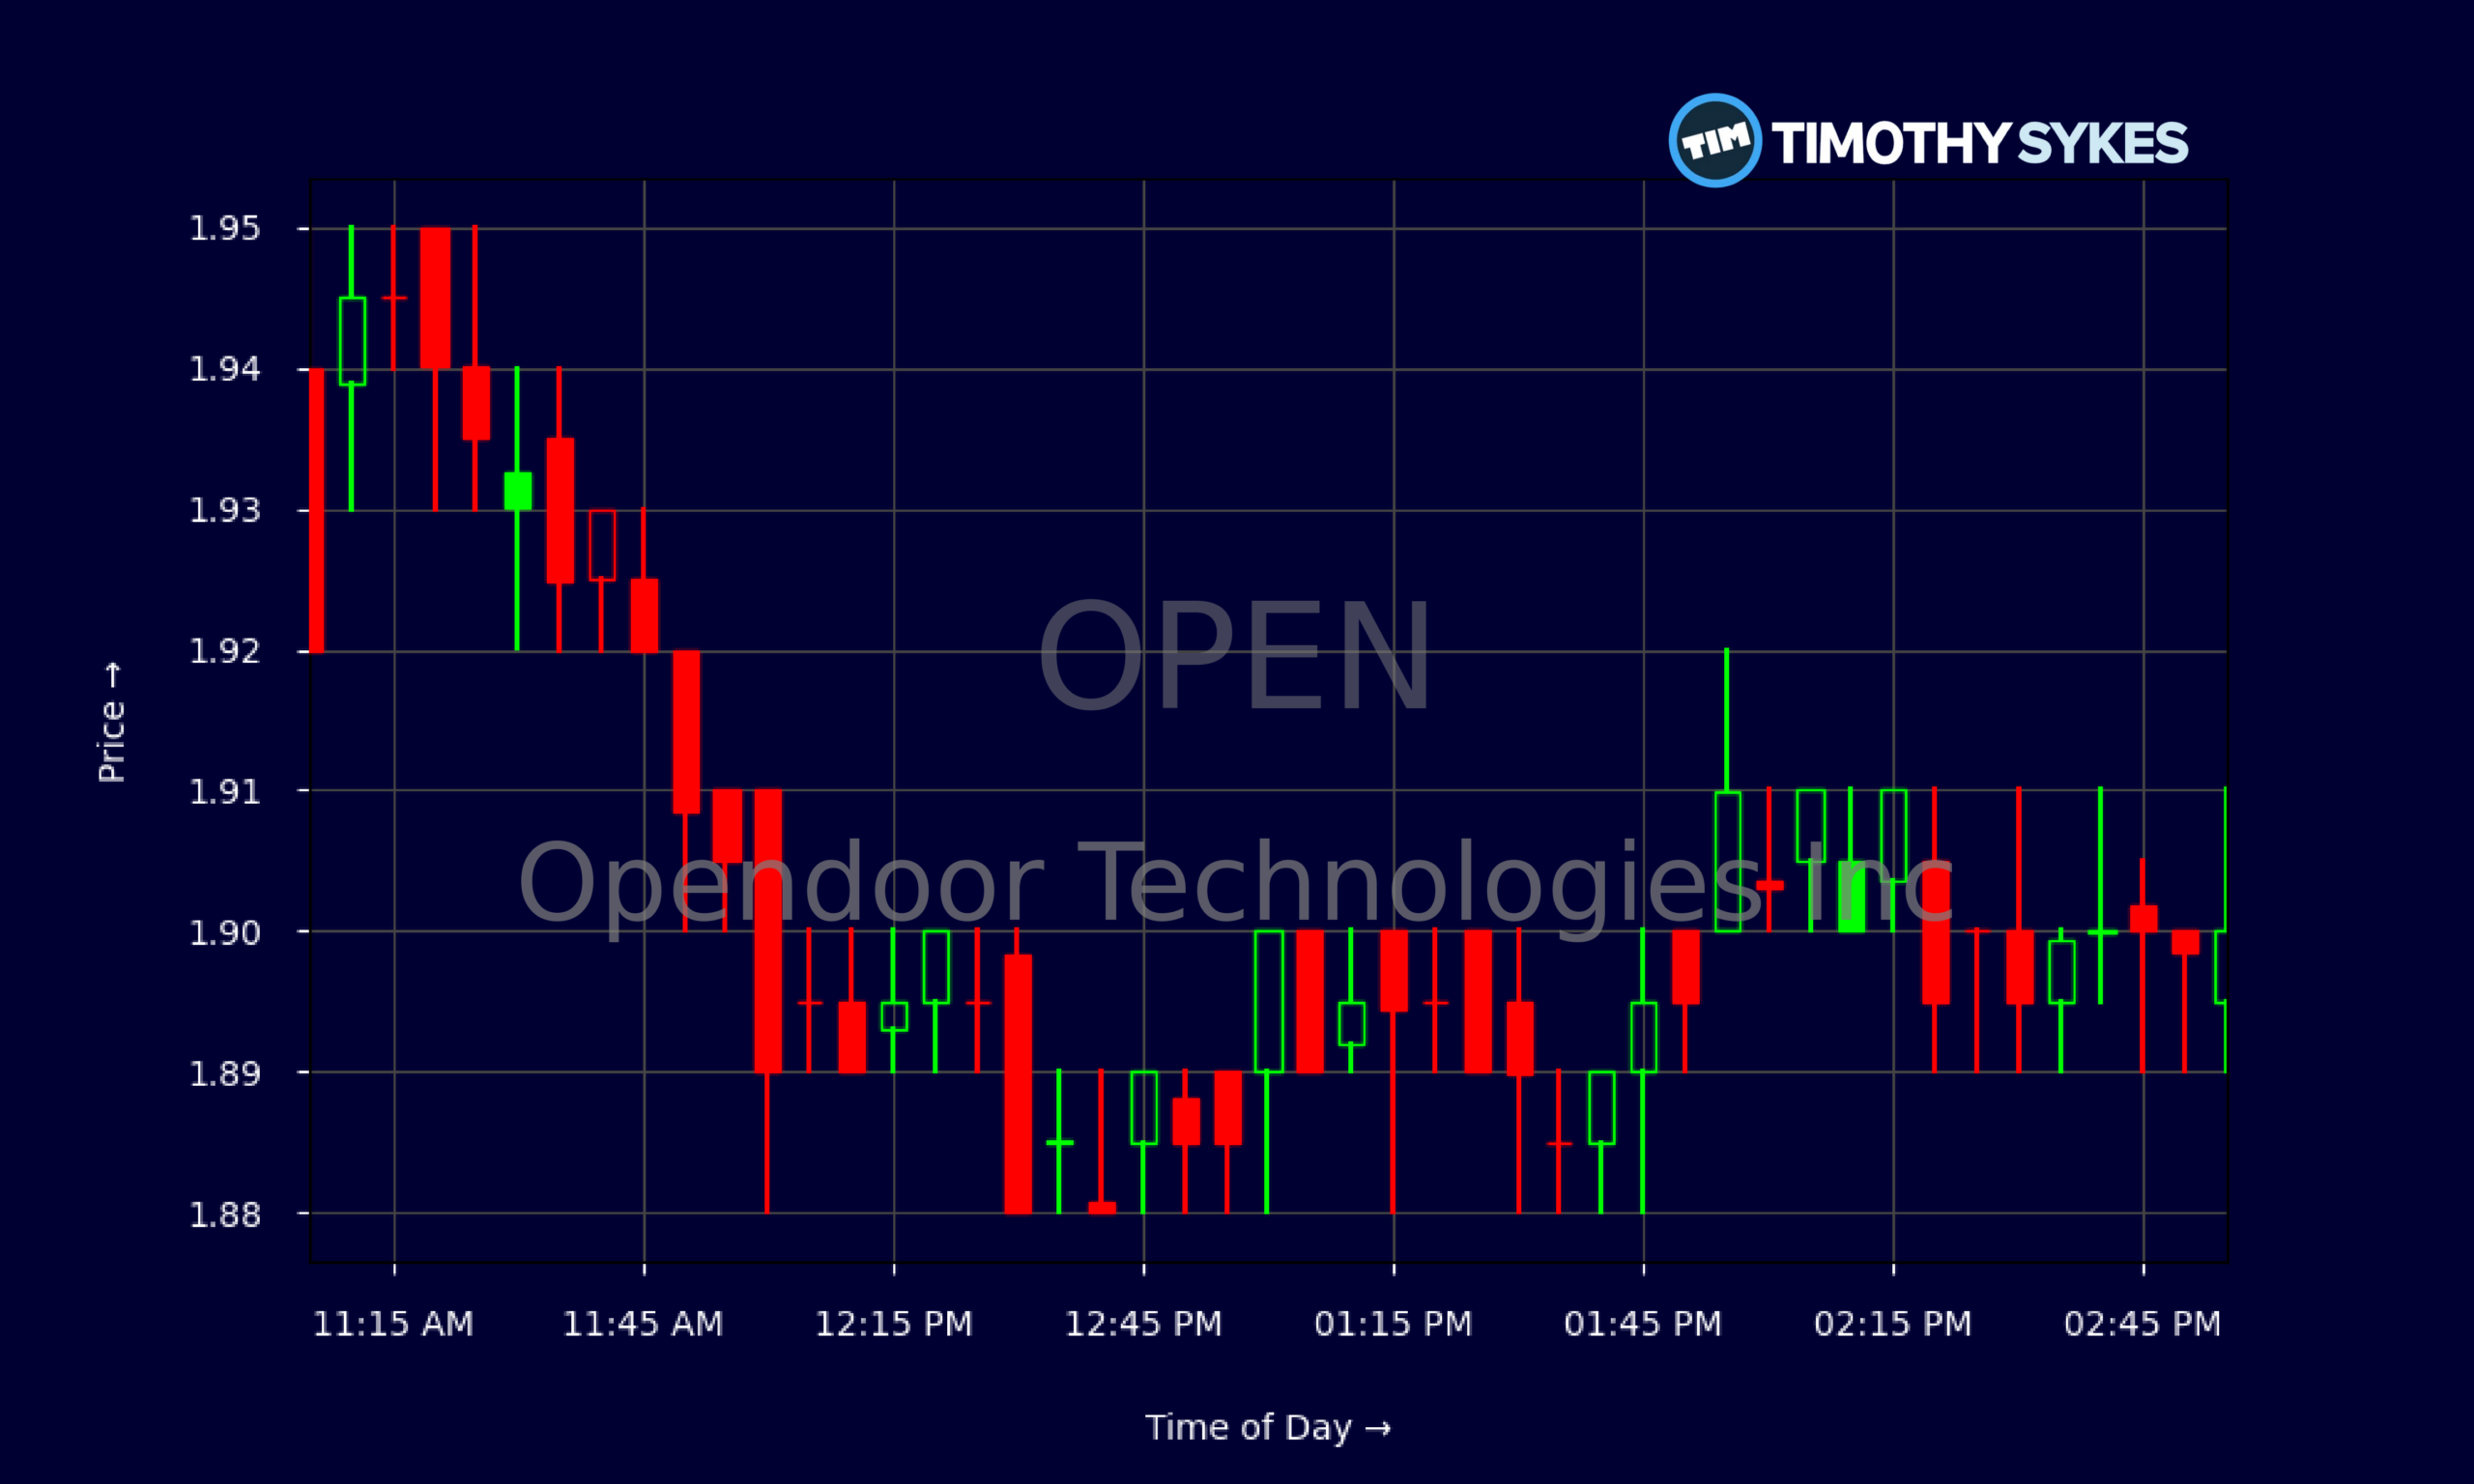
- Daily and intraday charts show tight consolidation in OPEN, with most trading pinned between $1.88 and $1.92, signaling indecision and shrinking volatility.
- OPEN posted about $4.37B in revenue but is still running with negative margins and heavy losses, raising questions about sustainability.
- Opendoor Technologies Inc holds roughly $896M in cash against sizable debt, giving runway but keeping balance-sheet risk on the radar for traders.
- Pattern-focused traders are watching support near $1.85 and resistance near $2.10 as potential breakout or breakdown levels for OPEN.
Live Update At 15:02:10 EDT: On Monday, October 26, 2026 Opendoor Technologies Inc stock [NASDAQ: OPEN] is trending down by -4.04%! Discover the key drivers behind this movement as well as our expert analysis in the detailed breakdown below.
Quick Financial Overview
Opendoor Technologies Inc is a classic high-revenue, high-burn story. OPEN generated about $4.37B in revenue, but the key issue is what’s left after costs. With a gross margin near 8.6% and a profit margin around -46%, Opendoor is selling a lot of houses but not turning that into bottom-line strength. That’s a red flag for many traders who care about sustainable business models.
The balance sheet gives OPEN some breathing room. The company holds roughly $896M in cash and $66M in restricted cash, with total current assets around $2.85B. On the other side, total liabilities run about $2.05B, including roughly $1.07B in long-term debt and $885M in current debt. That leverage pushes total debt-to-equity above 2, a level that demands close monitoring.
More Breaking News
Operating cash flow for the latest quarter came in at roughly -$718M, with free cash flow around -$723M. That’s aggressive burn. For traders, this combination—large revenue base, thin margins, and big negative cash flow—frames OPEN as a speculative name where sentiment and technicals can move price quickly.
Why Traders Are Watching OPEN’s Tight Range
From a trading standpoint, OPEN has shifted from a fast rollercoaster to a slow grind. Earlier in October, Opendoor Technologies Inc was trading above $2.40, even tagging $2.53 before sellers stepped in. Since then, daily candles show a steady drift lower, with the most recent close near $1.90. That’s roughly a 20–25% pullback from those short-term highs.
What stands out on the chart is range compression. Over the last few sessions, OPEN has mostly bounced between $1.84 and $2.03 on the daily chart. The intraday 5‑minute data shows even tighter bands, with most recent action stuck around $1.88–$1.92. When a once-volatile stock like Opendoor Technologies Inc starts moving in pennies instead of dimes, it often signals that big money is waiting for the next macro or sector catalyst.
For day traders, that can be both a blessing and a trap. Tight ranges around $1.90 give clear risk levels—support is building near $1.85, while prior intraday pushes toward $1.92–$1.95 and the daily zone near $2.05–$2.10 stand out as resistance. If OPEN breaks and holds above that $2.10 region with volume, it could signal a fresh momentum leg. A breakdown through $1.84 might invite a new wave of selling.
Because Opendoor Technologies Inc runs on a low price-to-sales ratio near 0.66 and trades under $2, small shifts in sentiment can create outsized percentage moves. That’s exactly the kind of setup many in the Sykes community scan for—clear levels, defined risk, and the potential for sharp, tradable swings when volume wakes up.
Conclusion
OPEN sits at an important crossroads. On one side, Opendoor Technologies Inc commands multi‑billion‑dollar revenue and holds close to $896M in cash with about $1.88B in working capital. That liquidity gives the company time to refine its playbook in a choppy housing and rate environment. On the other side, Opendoor is burning heavy cash, posting roughly -$718M in operating cash flow and a near -46% profit margin. That math doesn’t work forever.
For short-term traders, the story is less about distant profitability and more about price levels and volume. OPEN’s consolidation around $1.90, after a hard pullback from the $2.40–$2.50 zone, sets up a simple technical framework: monitor support near $1.85, watch resistance into $2.05–$2.10, and let the chart confirm direction before committing size. Opendoor Technologies Inc will likely remain a sentiment and momentum vehicle rather than a fundamentals‑driven swing for now. In this kind of volatile, range-bound action, discipline in preparation and waiting for ideal price action are critical for any trading thesis on OPEN. As millionaire penny stock trader and teacher Tim Sykes, says, “Preparation plus patience leads to big profits.” That approach keeps traders focused on planning entries and exits in advance, then waiting for the market to come to them instead of forcing trades.
As Tim Sykes loves to remind traders, “Cut losses quickly, because big losses can always be avoided.” That mindset fits OPEN perfectly. This is a name where the upside can be fast when the crowd piles in, but the downside is just as real given the cash burn and leverage. Treat Opendoor Technologies Inc as a trading vehicle, not a hope-and-pray hold, and let the chart—not emotions—call the shots.
This is stock news, not investment advice. Timothy Sykes News delivers real-time stock market news focused on key catalysts driving short-term price movements. Our content is tailored for active traders and investors seeking to capitalize on rapid price fluctuations, particularly in volatile sectors like penny stocks. Readers come to us for detailed coverage on earnings reports, mergers, FDA approvals, new contracts, and unusual trading volumes that can trigger significant short-term price action. Some users utilize our news to explain sudden stock movements, while others rely on it for diligent research into potential investment opportunities.
Dive deeper into the world of trading with Timothy Sykes, renowned for his expertise in penny stocks. Explore his top picks and discover the strategies that have propelled him to success with these articles:
- Penny Stocks Trading Guide
- Best Penny Stocks Under $1 to Buy Today
- Top 8 Penny Stocks to Watch on Robinhood
Once you’ve got some stocks on watch, elevate your trading game with StocksToTrade the ultimate platform for traders. With specialized tools for swing and day trading, StocksToTrade will guide you through the market’s twists and turns.
Dig into StocksToTrade’s watchlists here:





Leave a reply