

Nokia Corporation Sponsored stocks have been trading down by -3.63 percent amid bearish sentiment over weakening telecom infrastructure demand.
Key Takeaways
- Nokia’s ADRs led continental European decliners on 2026/07/28, dropping 6.3% while the broader Europe ADR index was nearly flat.
- On 2026/07/29, telecom equipment maker Nokia was again among top decliners, with its ADRs falling 3.6%.
- Nokia’s ADRs fell 2.6% on 2026/07/22, badly trailing a broader European ADR index that moved higher.
- On 2026/07/24, Nokia joined a group of European ADRs sliding about 2%–5% in an otherwise rising market.
- By 2026/08/07, Nokia’s ADRs were still underperforming, dropping roughly 0.6%–2.5% even as the S&P Europe Select ADR Index advanced.

Live Update At 16:47:10 EDT: On Tuesday, August 18, 2026 Nokia Corporation Sponsored stock [NYSE: NOK] is trending down by -3.63%! Discover the key drivers behind this movement as well as our expert analysis in the detailed breakdown below.
Quick Financial Overview
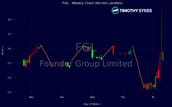
NOK has been grinding higher on the daily chart, but the path has been anything but smooth. From 2026/07/24 to 2026/08/18, Nokia stock climbed from around $9.10 to roughly $10.39, a gain of about 14%. That is a solid trend for swing traders, yet the news tape shows repeated selling pressure in the ADRs versus the wider European ADR universe.
Intraday on the latest session, NOK traded in a tight band between about $10.21 and $10.53. The 5‑minute candles show a classic churn day: early pop over $10.50, then hours of sideways action clustered around $10.37–$10.40. That kind of compression often sets up the next move. For active traders, NOK now sits above its early‑August range near $9.50–$9.90, turning that zone into a key support area to watch.
More Breaking News
On the fundamentals, Nokia carries about $19.22B in annual revenue and an enterprise value near $16.81B, putting its price‑to‑sales near 2.7. The headline number that jumps off the page is the lofty P/E near 77.7, despite modest returns on assets of 2.94% and return on equity of 5.82%. That mix tells traders the market is already pricing in meaningful improvement, leaving little room for execution mistakes.
Why Traders Are Watching NOK’s Persistent Underperformance
NOK is not just drifting with the market. The news flow over late July and early August shows a clear pattern of Nokia underperforming while European ADR benchmarks hold up or climb. For traders, that relative weakness matters more than any single red day.
The pressure started showing in the headlines around 2026/07/22, when Nokia’s ADRs dropped 2.6% even as the broader European ADR index pushed higher. When a liquid name like NOK lags a rising group, momentum traders take note. It hints at sellers leaning on the tape while the rest of the market is willing to bid.
Two days later, on 2026/07/24, Nokia was again listed among European ADRs sliding about 2%–5% in an otherwise rising market. That is not random noise. It is repeated confirmation that NOK keeps getting grouped with the weak links.
The real gut punch came on 2026/07/28, when Nokia’s ADRs led continental European decliners with a 6.3% drop while the broader Europe ADR index was almost flat. Leading the losers list on a quiet index day screams stock‑specific concern. And the next day, 2026/07/29, NOK fell another 3.6%, sharing the spotlight with Sequans Communications on the decliners board. Back‑to‑back heavy selling is exactly the kind of pattern short‑term traders stalk, either for continuation shorts or sharp oversold bounces.
Fast‑forward to early August. On 2026/08/05 and 2026/08/07, Nokia again showed up among decliners while European ADR gauges were slightly positive to outright advancing. This tells traders the underperformance is not a one‑week event; it is a theme. When a stock like NOK lags its sector and index repeatedly, many pros stop asking, “Is something wrong?” and start assuming, “Until proven otherwise, this is a sell‑the‑rip name.”
Conclusion
For active traders, NOK is now a classic tug‑of‑war setup. The daily chart shows Nokia grinding higher from the $8s into the low‑$10s, yet the news tape highlights repeated underperformance versus European ADR benchmarks from 2026/07/22 through 2026/08/07. That clash between price recovery and weak relative strength is where experienced traders hunt for opportunity.
On the bullish side, Nokia’s balance sheet is not falling apart. NOK holds about $5.46B in cash and short‑term investments against total liabilities of roughly $16.54B, and long‑term debt of about $2.33B. Working capital of $5.79B and equity near $20.97B give the company room to keep operating and investing in its network and telecom gear business. For swing traders, that stability can support longer‑duration holds as long as the uptrend and key support near $9.50–$9.90 stay intact.
On the cautious side, Nokia’s high P/E around 77.7, modest profitability, and repeated ADR underperformance say sentiment is fragile. If NOK breaks below recent support, late buyers may rush for the exits. As Tim Sykes likes to remind traders, “The market doesn’t care about your opinion, only your discipline.” As millionaire penny stock trader and teacher Tim Sykes, says, “Cut losses quickly, let profits ride, and don’t overtrade.”. For anyone trading NOK, that means respecting your charts, honoring your stop levels, and treating every setup as just one more trade, not a prediction about the company’s future.
This is stock news, not investment advice. Timothy Sykes News delivers real-time stock market news focused on key catalysts driving short-term price movements. Our content is tailored for active traders and investors seeking to capitalize on rapid price fluctuations, particularly in volatile sectors like penny stocks. Readers come to us for detailed coverage on earnings reports, mergers, FDA approvals, new contracts, and unusual trading volumes that can trigger significant short-term price action. Some users utilize our news to explain sudden stock movements, while others rely on it for diligent research into potential investment opportunities.
Dive deeper into the world of trading with Timothy Sykes, renowned for his expertise in penny stocks. Explore his top picks and discover the strategies that have propelled him to success with these articles:
- Penny Stocks Trading Guide
- Best Penny Stocks Under $1 to Buy Today
- Top 8 Penny Stocks to Watch on Robinhood
Once you’ve got some stocks on watch, elevate your trading game with StocksToTrade the ultimate platform for traders. With specialized tools for swing and day trading, StocksToTrade will guide you through the market’s twists and turns.
Dig into StocksToTrade’s watchlists here:




Leave a reply