

Cypherpunk Technologies Inc. stocks have been trading down by -3.99 percent amid heightened market concerns over digital-asset regulatory risks.
Key Takeaways
- Recent trading shows CYPH more than tripling from mid-August lows, attracting short-term momentum traders.
- Intraday action in Cypherpunk Technologies Inc. now shows a tight range around $2.50–$2.60, signaling consolidation after a sharp spike.
- The latest report shows CYPH holding $7.6M in cash with zero long-term debt, giving the company breathing room.
- Profitability ratios for CYPH remain weak, so many traders are treating this move as a technical, not fundamental, setup.

Live Update At 15:03:19 EDT: On Wednesday, September 09, 2026 Cypherpunk Technologies Inc. stock [NASDAQ: CYPH] is trending down by -3.99%! Discover the key drivers behind this movement as well as our expert analysis in the detailed breakdown below.
Quick Financial Overview
Cypherpunk Technologies Inc. is a classic small-cap story where the chart is moving faster than the fundamentals. CYPH shows a market-friendly balance sheet: about $142.97M in total assets, $139.32M in equity, and only $3.65M in total liabilities. On paper, that’s a very light debt load. Cash sits near $7.62M, and the current ratio, at 79.2, tells traders CYPH has far more current assets than near-term obligations.
But the income picture is messy. CYPH’s trailing revenue trend is negative, and key profitability metrics flash red. Return on assets and return on equity are both sharply negative, signaling that Cypherpunk Technologies Inc. has not yet turned its asset base into consistent earnings. Much of the latest “profit” stems from gains on securities, not core operations.
More Breaking News
Valuation-wise, CYPH trades around 1.87 times book value, with a low-looking P/E that’s skewed by those one-off gains. For traders, the takeaway is simple: Cypherpunk Technologies Inc. is financially liquid but fundamentally unproven, so price action and risk management matter more than long-term projections.
Why Traders Are Watching CYPH Price Action
The real story in CYPH right now is on the chart. From 2026/08/17 to 2026/09/09, Cypherpunk Technologies Inc. ripped from a close near $0.71 to about $2.53. That’s a high-velocity multi-bagger move in just a few weeks. For active traders, a move like that screams “momentum playground.”
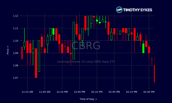
Look at the recent daily candles. CYPH spent late August grinding between roughly $1.60 and $1.90, then broke out above $2.00 in early September. The stock pushed to a high above $3.20 on 2026/09/09 before pulling back to the mid-$2s. That kind of spike-and-fade pattern is textbook for a speculative runner that’s cooling off and resetting.
Intraday, the 5‑minute data reinforces that view. Early in the session, CYPH traded above $3.00, then steadily bled lower toward $2.50. Volume thinned and the range tightened, with Cypherpunk Technologies Inc. holding a band around $2.50–$2.60 for hours. That’s classic consolidation after a morning blow-off.
Traders who study price action see a few key lessons in CYPH. First, parabolic moves often retrace fast; chasing at the highs is dangerous. Second, a tight intraday base after a big run can either set up the next leg higher or a deeper fade. The edge comes from planning both outcomes, not predicting just one.
Conclusion
For short-term traders, CYPH is a case study in how a small, fundamentally shaky name can still produce massive trading opportunities. Cypherpunk Technologies Inc. has strong liquidity and minimal debt, which reduce bankruptcy-type fears, but its negative returns on assets and equity remind everyone this is not a steady earnings machine. The recent gains lean more on speculation and market psychology than on durable cash flow.
That’s why the focus with CYPH should be on levels, not stories. The $2.00 zone on the daily chart looks like an important support area from the initial breakout. The $3.00–$3.25 range marks clear recent resistance where Cypherpunk Technologies Inc. met heavy selling. Traders can use those zones to define risk and avoid emotional decisions.
Tim Sykes likes to say, “The market doesn’t care about your opinion, only your preparation.” As millionaire penny stock trader and teacher Tim Sykes, says, “Embrace the journey, the ups and downs; each mistake is a lesson to improve your strategy.”. CYPH fits that perfectly. Whether Cypherpunk Technologies Inc. breaks higher from this consolidation or unwinds further, the traders who do best will be the ones who size small, cut losses fast, and react to the chart instead of marrying a bias. This is educational material, not a signal, but CYPH is a live reminder that disciplined trading always beats hope.
This is stock news, not investment advice. Timothy Sykes News delivers real-time stock market news focused on key catalysts driving short-term price movements. Our content is tailored for active traders and investors seeking to capitalize on rapid price fluctuations, particularly in volatile sectors like penny stocks. Readers come to us for detailed coverage on earnings reports, mergers, FDA approvals, new contracts, and unusual trading volumes that can trigger significant short-term price action. Some users utilize our news to explain sudden stock movements, while others rely on it for diligent research into potential investment opportunities.
Dive deeper into the world of trading with Timothy Sykes, renowned for his expertise in penny stocks. Explore his top picks and discover the strategies that have propelled him to success with these articles:
- Penny Stocks Trading Guide
- Best Penny Stocks Under $1 to Buy Today
- Top 8 Penny Stocks to Watch on Robinhood
Once you’ve got some stocks on watch, elevate your trading game with StocksToTrade the ultimate platform for traders. With specialized tools for swing and day trading, StocksToTrade will guide you through the market’s twists and turns.
Dig into StocksToTrade’s watchlists here:




Leave a reply