

Corteva Inc. stocks have been trading down by -5.09 percent amid bearish sentiment over weaker agricultural demand and earnings outlook.
What Traders Need To Know
- Seed business has been spun out into new public company Vylor, leaving Corteva Inc. focused on the remaining portfolio.
- After the Vylor separation, CTVA shares dropped more than 81%, with some reports calling out an 84.3% plunge.
- A U.S. District Court denied California’s request to block the spin-off, clearing the path for the transaction and the sharp repricing.
- Earlier, Corteva Inc., Chemours, and DuPont agreed to a $455M PFAS settlement with North Carolina and local entities, and CTVA fell about 4.5% as materials lagged.

Weekly Update Sep 28 – Oct 02, 2026: On Friday, October 02, 2026 Corteva Inc. stock [NYSE: CTVA] is trending down by -5.09%! Discover the key drivers behind this movement as well as our expert analysis in the detailed breakdown below.
Materials industry expert:
Analyst sentiment – negative
Corteva’s post-spin profile is now a more focused crop-protection and traits business, but the fundamentals look mixed. Margins are solid for the group (gross margin ~49.5%, EBITDA margin 16.8%, EBIT margin 9.9%), and leverage is conservative (debt/equity 0.19, interest coverage 17x). However, profitability on capital is weak (ROE ~4–5%, ROIC 4–5%) versus specialty-chem peers in low double digits. Cash generation is stressed: Q2 free cash flow was –$588m, with negative operating cash flow despite strong reported net income, reflecting heavy working-capital outflows and sizable pension/benefit charges. The stock trades at ~2.9x sales and over 50x trailing earnings, rich relative to global ag-chem and diversified materials peers at mid-teens P/E and ~1.5–2x sales, especially given mid-single-digit revenue growth.
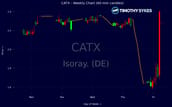
Technically, the tape has been reset by the Vylor spin, with the 77–78 handle representing the pre-spin price and the current 11–13 zone the new post-spin range. The abrupt 80%+ price gap down on heavy volume signals forced de-risking and index-related selling, not a conventional breakdown from prior support. On the new scale, 12.50–13.00 has emerged as initial resistance, with multiple 5-minute candles rejecting that band intraday, while 11.80–12.00 is near-term support from the first post-spin low. Dominant trend on the weekly is firmly down, but short-term price action shows early attempt at base-building. An actionable trading level is a break-and-hold above 13.00 on strong volume, which would confirm the first higher high on the new structure and open room toward the mid-teens; conversely, loss of 11.80 would likely trigger another wave of mechanical selling.
Fundamentally, the Vylor separation removes a high-quality seed asset and leaves Corteva more exposed to crop-protection cycles and regulatory risk, including PFAS exposure evidenced by the recent $455m settlement with North Carolina. Relative to global materials and ag benchmarks (e.g., S&P 1500 Materials, global ag-chem basket), Corteva now screens as lower quality at a premium multiple with inferior returns on capital and weak near-term cash flow. The sector backdrop is only moderately supportive, with pressured farm incomes and normalizing input costs. I expect the stock to underperform materials and agriculture indices over the next 12–18 months as the market recalibrates to the ex-seed earnings base and potential further PFAS liabilities. Key levels: near-term resistance at 13.00, then 15.00; support at 11.80, then 10.50. My base-case 12-month fair value is in the 10–11 range on the new post-spin structure, implying limited upside and a skewed risk profile.
More Breaking News
Quick Financial Overview
Corteva Inc. (CTVA) just went through a massive structural reset. The weekly tape tells the story clearly: the stock traded around the high-$70s and then collapsed to the low-$10s after the Vylor spin-off. That kind of 80%+ gap is a full re-pricing of what remains inside CTVA post-spin, not a routine pullback. Traders need to treat today’s chart as almost a new listing rather than an extension of the old range.
Intraday, the 5-minute chart shows CTVA stabilizing between roughly $11.90 and $12.20 for much of the session, with a morning push above $12.80 that quickly faded. The stock opened near $12.40, popped toward $13.00, then settled into a tight $12.00–$12.20 band through the afternoon before closing just under $12.00. That action says initial panic is giving way to price discovery, but there is no clear trend yet. Liquidity is present, and the range is tradeable, but risk is high because there is no long-term reference level nearby.
Fundamentally, Corteva Inc. still shows solid margins for an ag-chem name, with gross margin near 49.5% and EBIT margin around 9.9%. Revenue sits around $17.4B, with modest multi‑year growth, and leverage looks reasonable with total debt-to-equity near 0.19 and current ratio about 1.5. At the same time, the trailing P/E of roughly 50.7 and price-to-sales near 2.9 now need to be reinterpreted after the Vylor carve‑out, because earnings and sales power tied to the seed business have moved out. Add in a rich intangible base and a roughly 5.7% dividend yield off a $0.72 annual rate, and traders should expect ongoing debate about how sustainable CTVA’s cash flows look in this new, smaller configuration.
Conclusion
Corteva Inc. is now a very different trading vehicle than it was before the Vylor spin-off. The roughly 80%+ price collapse from the high-$70s into the low-$10s is not just sentiment; it reflects a major transfer of business value into the new seed company. At the same time, CTVA is still generating more than $6.3B in quarterly revenue with healthy margins, but recent cash-flow data shows negative free cash flow and heavy working-capital swings. For short-term traders, that mix of solid income statement, messy cash flows, and headline risk around PFAS settlements creates a classic high‑volatility setup. As millionaire penny stock trader and teacher Tim Sykes says, “Preparation plus patience leads to big profits.” That mindset is especially relevant here, because understanding the new fundamentals and waiting for clean technical levels is critical when trading a name that has just undergone such a violent repricing.
On the chart, the key job now is to map out a new base. The intraday band between $12.00 and $12.80 is the first real battlefield where buyers and sellers are negotiating what Corteva Inc. is worth without the Vylor seed engine. A break under the $11.90–$12.00 area could trigger another round of forced de‑risking, while a firm reclaim and hold above $13.00 would hint that the initial shock is fading. CTVA remains a headline‑driven name, with legal overhangs and restructuring noise likely to drive gaps for some time. As I tell my students, “When a stock has been repriced this violently, you trade the levels and the volume, not your old assumptions about the company.””,”scores”:{“risk-level”:”high”},”trade”:”true
This is stock news, not investment advice. Timothy Sykes News delivers real-time stock market news focused on key catalysts driving short-term price movements. Our content is tailored for active traders and investors seeking to capitalize on rapid price fluctuations, particularly in volatile sectors like penny stocks. Readers come to us for detailed coverage on earnings reports, mergers, FDA approvals, new contracts, and unusual trading volumes that can trigger significant short-term price action. Some users utilize our news to explain sudden stock movements, while others rely on it for diligent research into potential investment opportunities.
Dive deeper into the world of trading with Timothy Sykes, renowned for his expertise in penny stocks. Explore his top picks and discover the strategies that have propelled him to success with these articles:
- Penny Stocks Trading Guide
- Best Penny Stocks Under $1 to Buy Today
- Top 8 Penny Stocks to Watch on Robinhood
Once you’ve got some stocks on watch, elevate your trading game with StocksToTrade the ultimate platform for traders. With specialized tools for swing and day trading, StocksToTrade will guide you through the market’s twists and turns.
Dig into StocksToTrade’s watchlists here:




Leave a reply