

Bloomin’ Brands Inc. faces pressure as weak consumer spending hits casual dining, and its stocks have been trading down by -10.22 percent.
Market Insights For Bloomin’ Brands Traders
- Citi slightly reduced its price target on Bloomin’ Brands from $12.75 to $12.25 while maintaining a Neutral rating.
- The new price target implies modest downside or limited upside for Bloomin’ Brands from current levels.
- Citi’s stance indicates tempered expectations without a strong bullish or bearish call on the stock.
- Recent weekly action shows BLMN fading from above $10 into the low $9s, signaling pressure near prior highs.
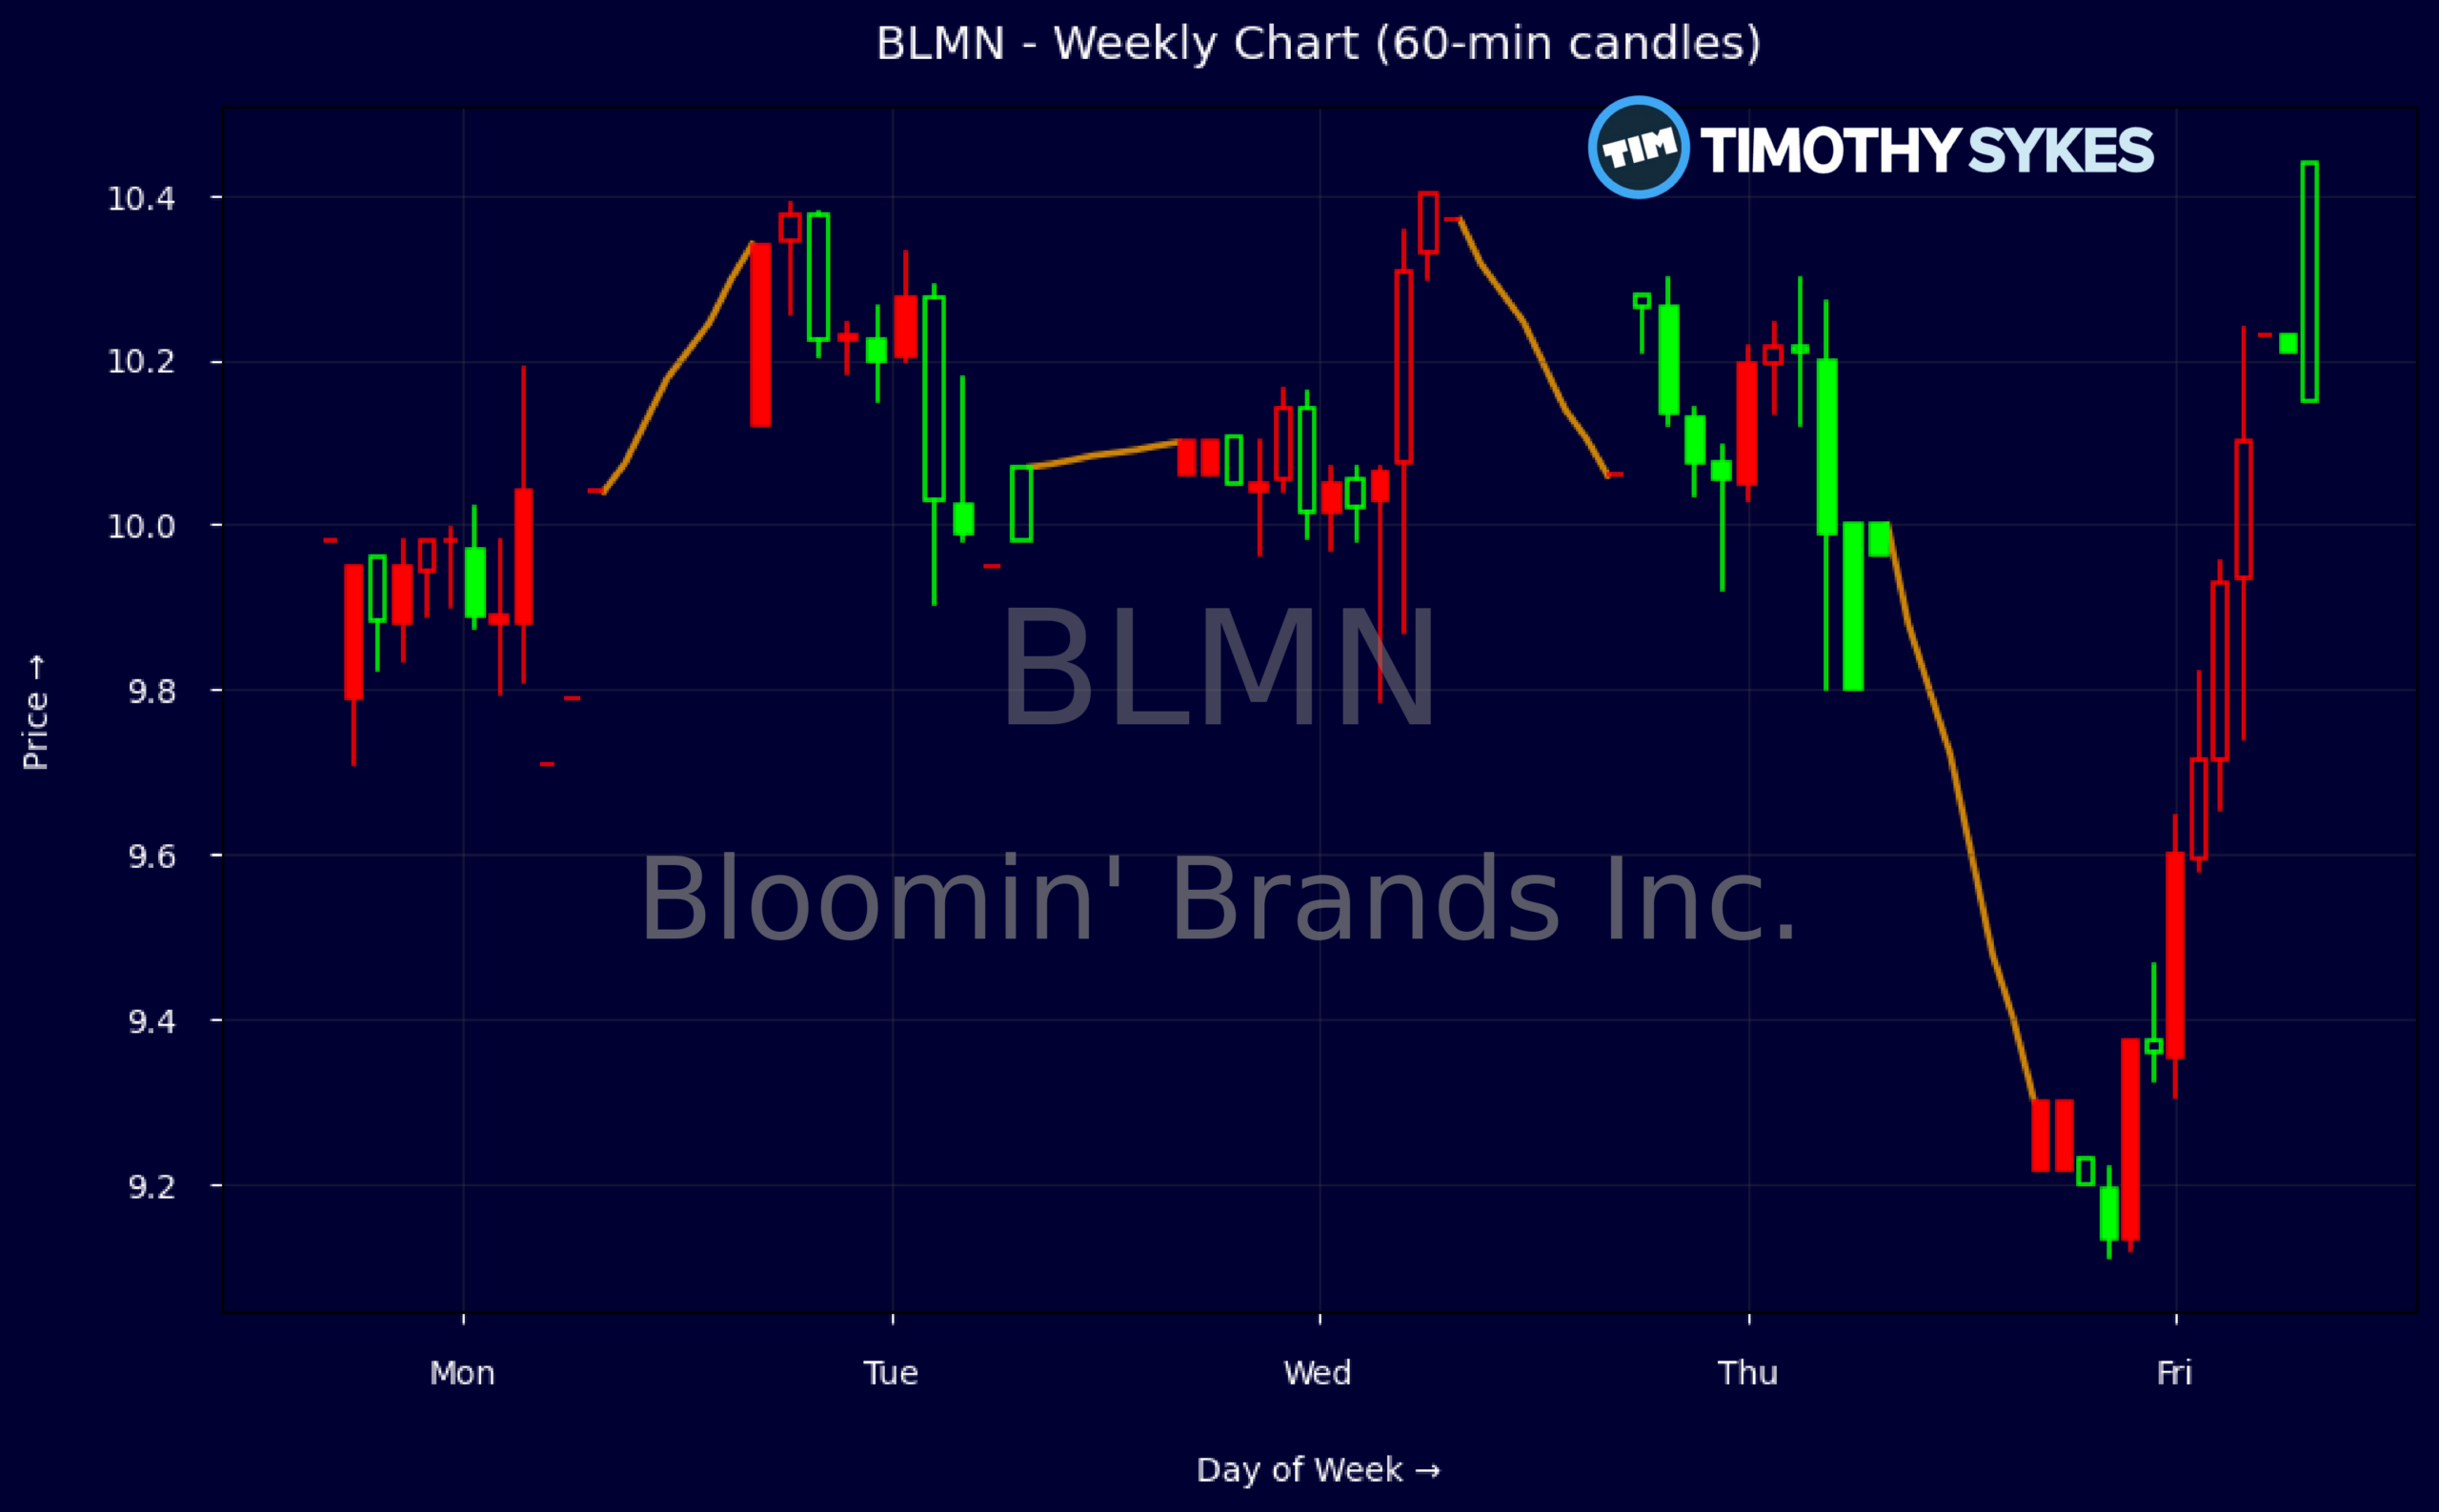
Weekly Update Oct 19 – Oct 23, 2026: On Sunday, October 25, 2026 Bloomin’ Brands Inc. stock [NASDAQ: BLMN] is trending down by -10.22%! Discover the key drivers behind this movement as well as our expert analysis in the detailed breakdown below.
Consumer Discretionary industry expert:
Analyst sentiment – neutral
Bloomin’ Brands operates subscale versus leading casual dining peers but maintains solid brand equity in Outback and Carrabba’s. Fundamentals are mixed: low gross margin (13.4%) and thin EBIT margin (1.2%) reflect cost pressure and discounting, while ROE of 15% on high leverage (total debt/equity 4.4x, leverage 7.2x) magnifies equity returns and risk. Cash conversion is a relative strength: price-to-free-cash at 3.2x and price-to-sales at 0.19x imply a deeply discounted, debt-constrained equity.
Technically, BLMN is in a fragile, short-term downtrend after failing to hold the 10.30–10.35 area; the weekly sequence from 9.95 to a 10.34 high and a sharp break to a 9.20 low signals supply overwhelming demand above 10. Volume has increased on down days, confirming distribution. Intraday 5-minute candles show repeated selling into minor bounces near 9.70–9.80. The actionable level is support at 9.10–9.25: aggressive buyers can enter near 9.25 with a tight stop below 9.00.
Citi’s small target cut to $12.25 with a Neutral rating aligns with the setup of a cheap, range-bound, highly leveraged restaurant operator lagging both Consumer Discretionary and Restaurants & Bars indices on growth and quality. Key catalysts are cost normalization, traffic stabilization, and any balance-sheet de-risking. Base case: trading range 9–12 over the next 12 months, with resistance at 10.75 and 12.00, support at 9.10. Risk/reward is balanced; stance remains Neutral.
More Breaking News
Quick Financial Overview
Bloomin’ Brands Inc. sits in a tricky middle ground right now. On the chart, BLMN pushed above $10 early in the recent week but could not hold those levels, fading to around $9.21 by week’s end. Intraday, a wide 5-minute bar that ran from just above $10 down toward $9.20 shows aggressive selling pressure, suggesting trapped late buyers above $10 and short-term control by sellers.
On the news side, Citi’s slight cut of its price target from $12.75 to $12.25, with a Neutral rating, tells traders the firm sees limited edge either way. That target still sits above the recent $9–$10 trading band, but the cut signals reduced confidence in upside follow-through. For short-term traders, this kind of neutral Wall Street stance often means the stock trades more on technical levels and short-term restaurant trends than on fresh analyst momentum.
Under the hood, Bloomin’ Brands Inc. generated about $3.96B in trailing revenue, but with thin margins: EBIT margin stands near 1.2% and net margin under 1%. A price-to-sales ratio around 0.19 and price-to-free-cash near 3.2 show BLMN screens cheap on sales and cash flow, yet leverage is heavy, with total debt-to-equity above 4 and a current ratio around 0.3. Cash flow is a relative strength: recent quarterly operating cash flow near $90.9M and free cash flow around $46.9M give the company breathing room despite meaningful debt repayments and negative working capital.
Conclusion
This is stock news, not investment advice. Timothy Sykes News delivers real-time stock market news focused on key catalysts driving short-term price movements. Our content is tailored for active traders and investors seeking to capitalize on rapid price fluctuations, particularly in volatile sectors like penny stocks. Readers come to us for detailed coverage on earnings reports, mergers, FDA approvals, new contracts, and unusual trading volumes that can trigger significant short-term price action. Some users utilize our news to explain sudden stock movements, while others rely on it for diligent research into potential investment opportunities.
Dive deeper into the world of trading with Timothy Sykes, renowned for his expertise in penny stocks. Explore his top picks and discover the strategies that have propelled him to success with these articles:
- Penny Stocks Trading Guide
- Best Penny Stocks Under $1 to Buy Today
- Top 8 Penny Stocks to Watch on Robinhood
Once you’ve got some stocks on watch, elevate your trading game with StocksToTrade the ultimate platform for traders. With specialized tools for swing and day trading, StocksToTrade will guide you through the market’s twists and turns.
Dig into StocksToTrade’s watchlists here:





Leave a reply