
Right now is one of the BEST times to trade penny stocks.
Yet, most people aren’t aware.
They get chart tunnel vision and only look at one or two timeframes…
Never seeing the big picture.
Let me ask you a simple question…
Would you rather trade with the crowd or against it?
I don’t know about you, but I prefer the easier path.
But they’ll trample over me if I’m not facing the right direction.
That’s what it’s like when you only look at a stock from one angle.
And it’s not just about going from a one-minute to an hourly chart.
Seasonal patterns play a HUGE part in trading.
Just the other day, I explained how most people get the ‘January Effect’ totally wrong.
They aren’t paying attention to one of the juiciest moments in a penny stock trader’s year.
If they were, they’d know that stocks like Cloudweb Inc. (OTC: CLOW) or GlycoMimetrics Inc. (NASDAQ: GLYC) offered multiple AMAZING dip buy opportunities over the past few weeks.
The problem is most traders see a stock like CLOW on a multi-day run and think…
Guess I missed the trade…
They don’t realize that trades exist on other timeframes.
As a matter of fact, they can use this larger trend to make those trades even MORE profitable.
That might sound confusing, which is why I want to demonstrate how I look at multiple timeframes to design better setups.
Accounting for Seasonality

2025 Millionaire Media, LLCPicture seasonality as an ocean current.
It subtly changes throughout the year making it more or less difficult to traverse certain paths and for certain types of vessels.
Right now, money managers are dumping their worst stocks to take tax loss write-offs by the end of the year.
That puts extra pressure on some sectors, but also creates severely oversold conditions.
Most folks assume this means a bounce in January.
In fact, the moves can start as early as November.
Over the last 4-6 months I took many small trades to ‘test the waters.’
With penny stocks fading nearly every afternoon, I wanted to know when things would change.
Somewhere around October, I began to see a shift.
More setups appeared and a few stocks here and there would run for several days.
Now, I’m seeing this happen more and more frequently.
And I only expect it to get stronger as we finish out the year.
Taking this into account, I plan to take more risk methodically and carefully.
I don’t expect stocks to pop off as they did in 2021. But I do see a ton of opportunity if you know where to look.
Where Are We in the Framework?

2025 Millionaire Media, LLCWhenever I look at a chart, I ask myself…
Where are we in my 7-Step Penny Stock Framework?
Each phase is suited for different types of trades.
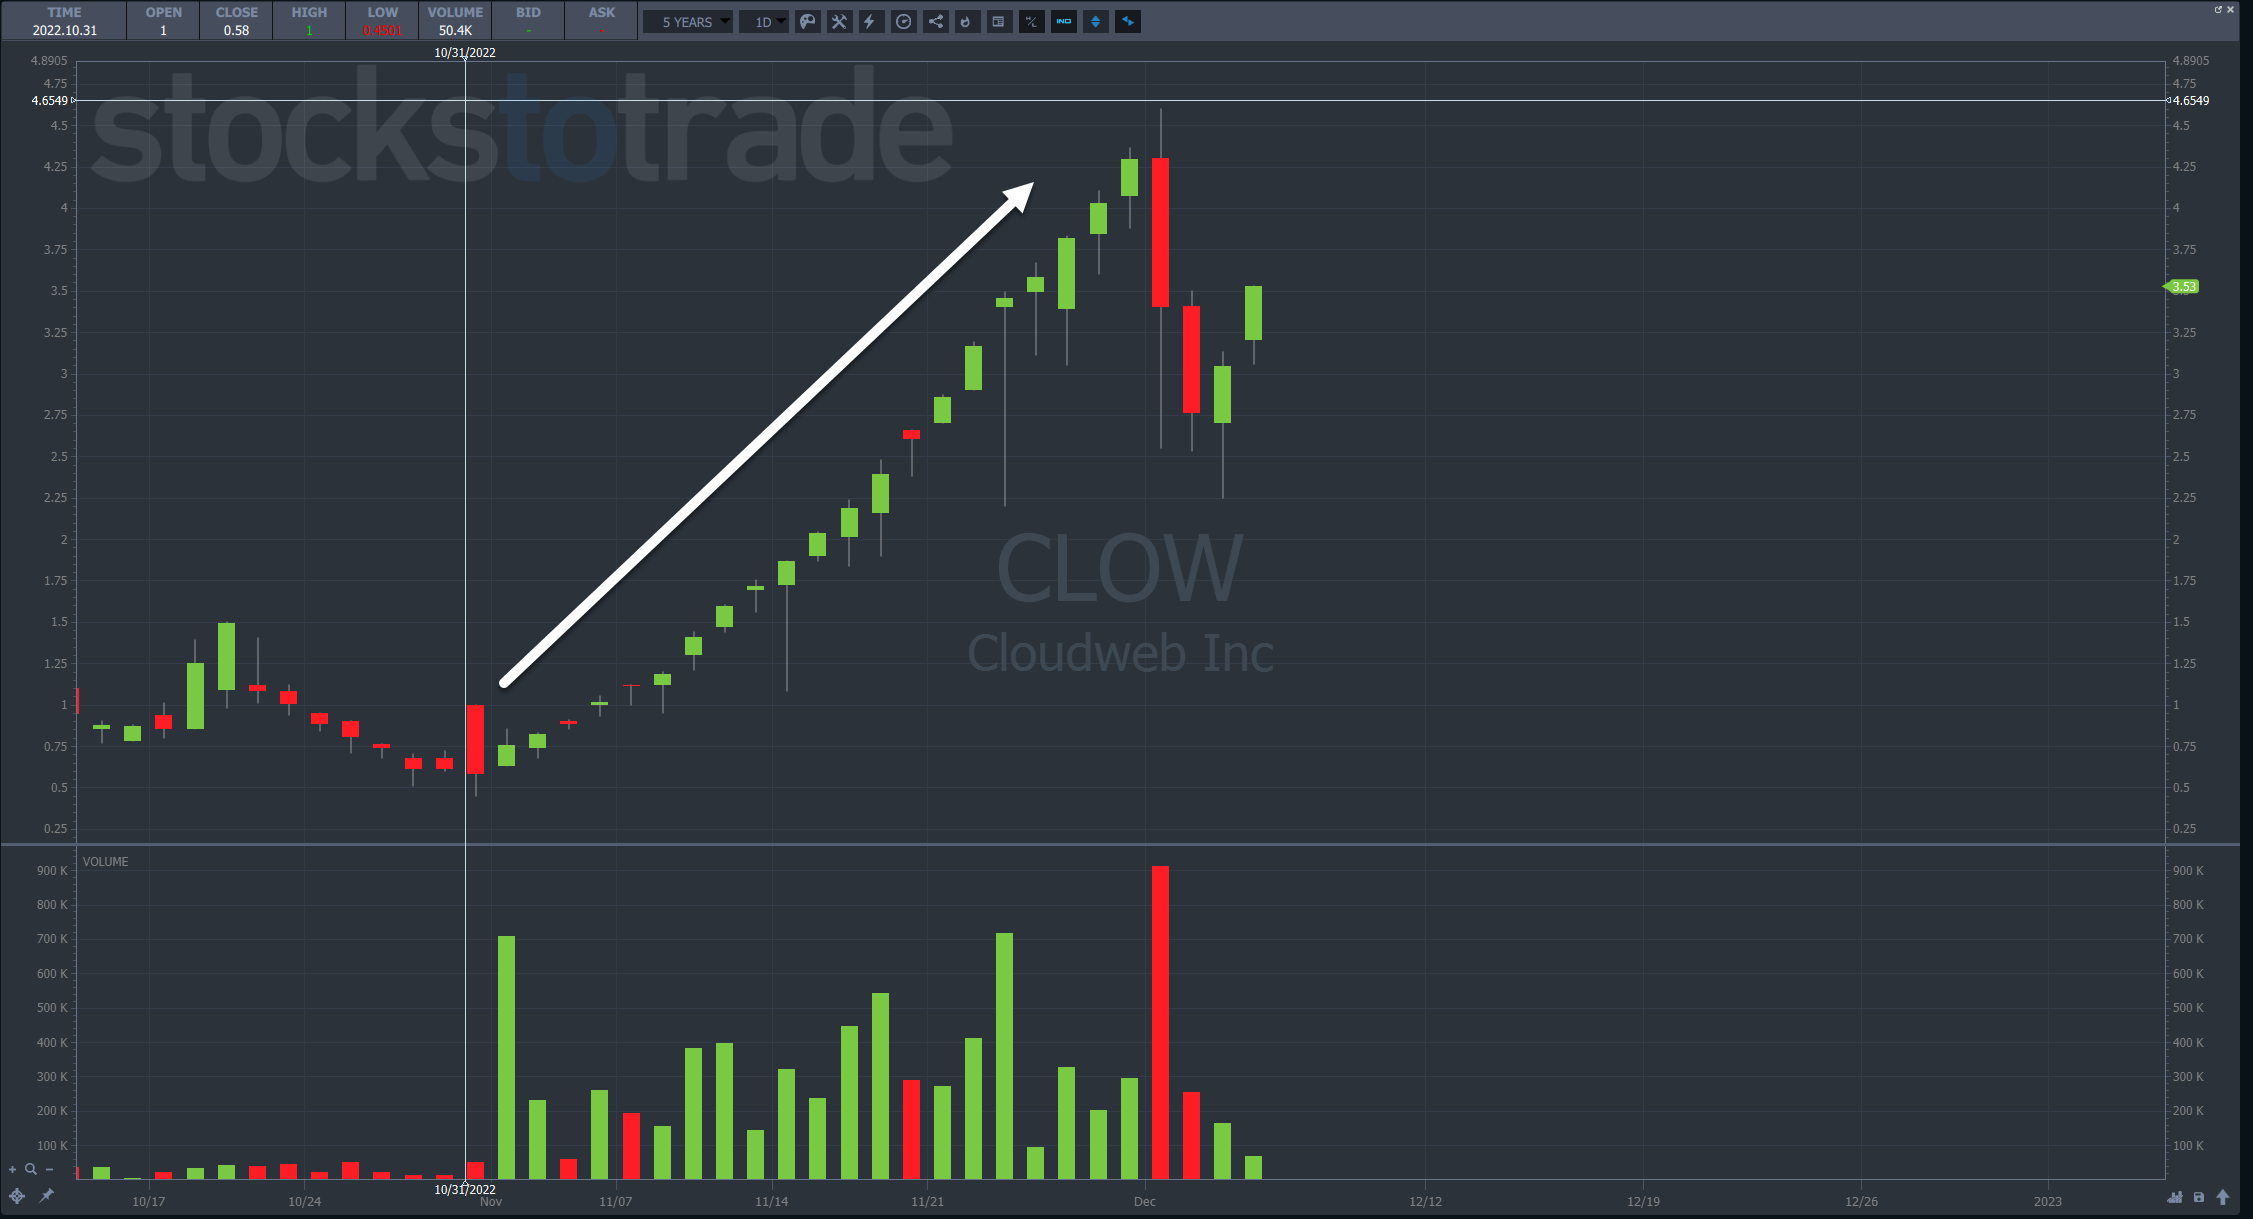
As an example, CLOW spent several weeks in Phase 2: The Ramp.
This created opportunities to buy panic tips.
Think of it this way.
On the daily chart, nearly every day closed green for several weeks.
So, if a stock drops down to a key support level, why not try and scoop it up for a reversal?
In a one-minute timeframe, it looks scary.
But when you take a step back, things become clearer.
Let’s zoom in on the price action on November 14th so you can see an example.
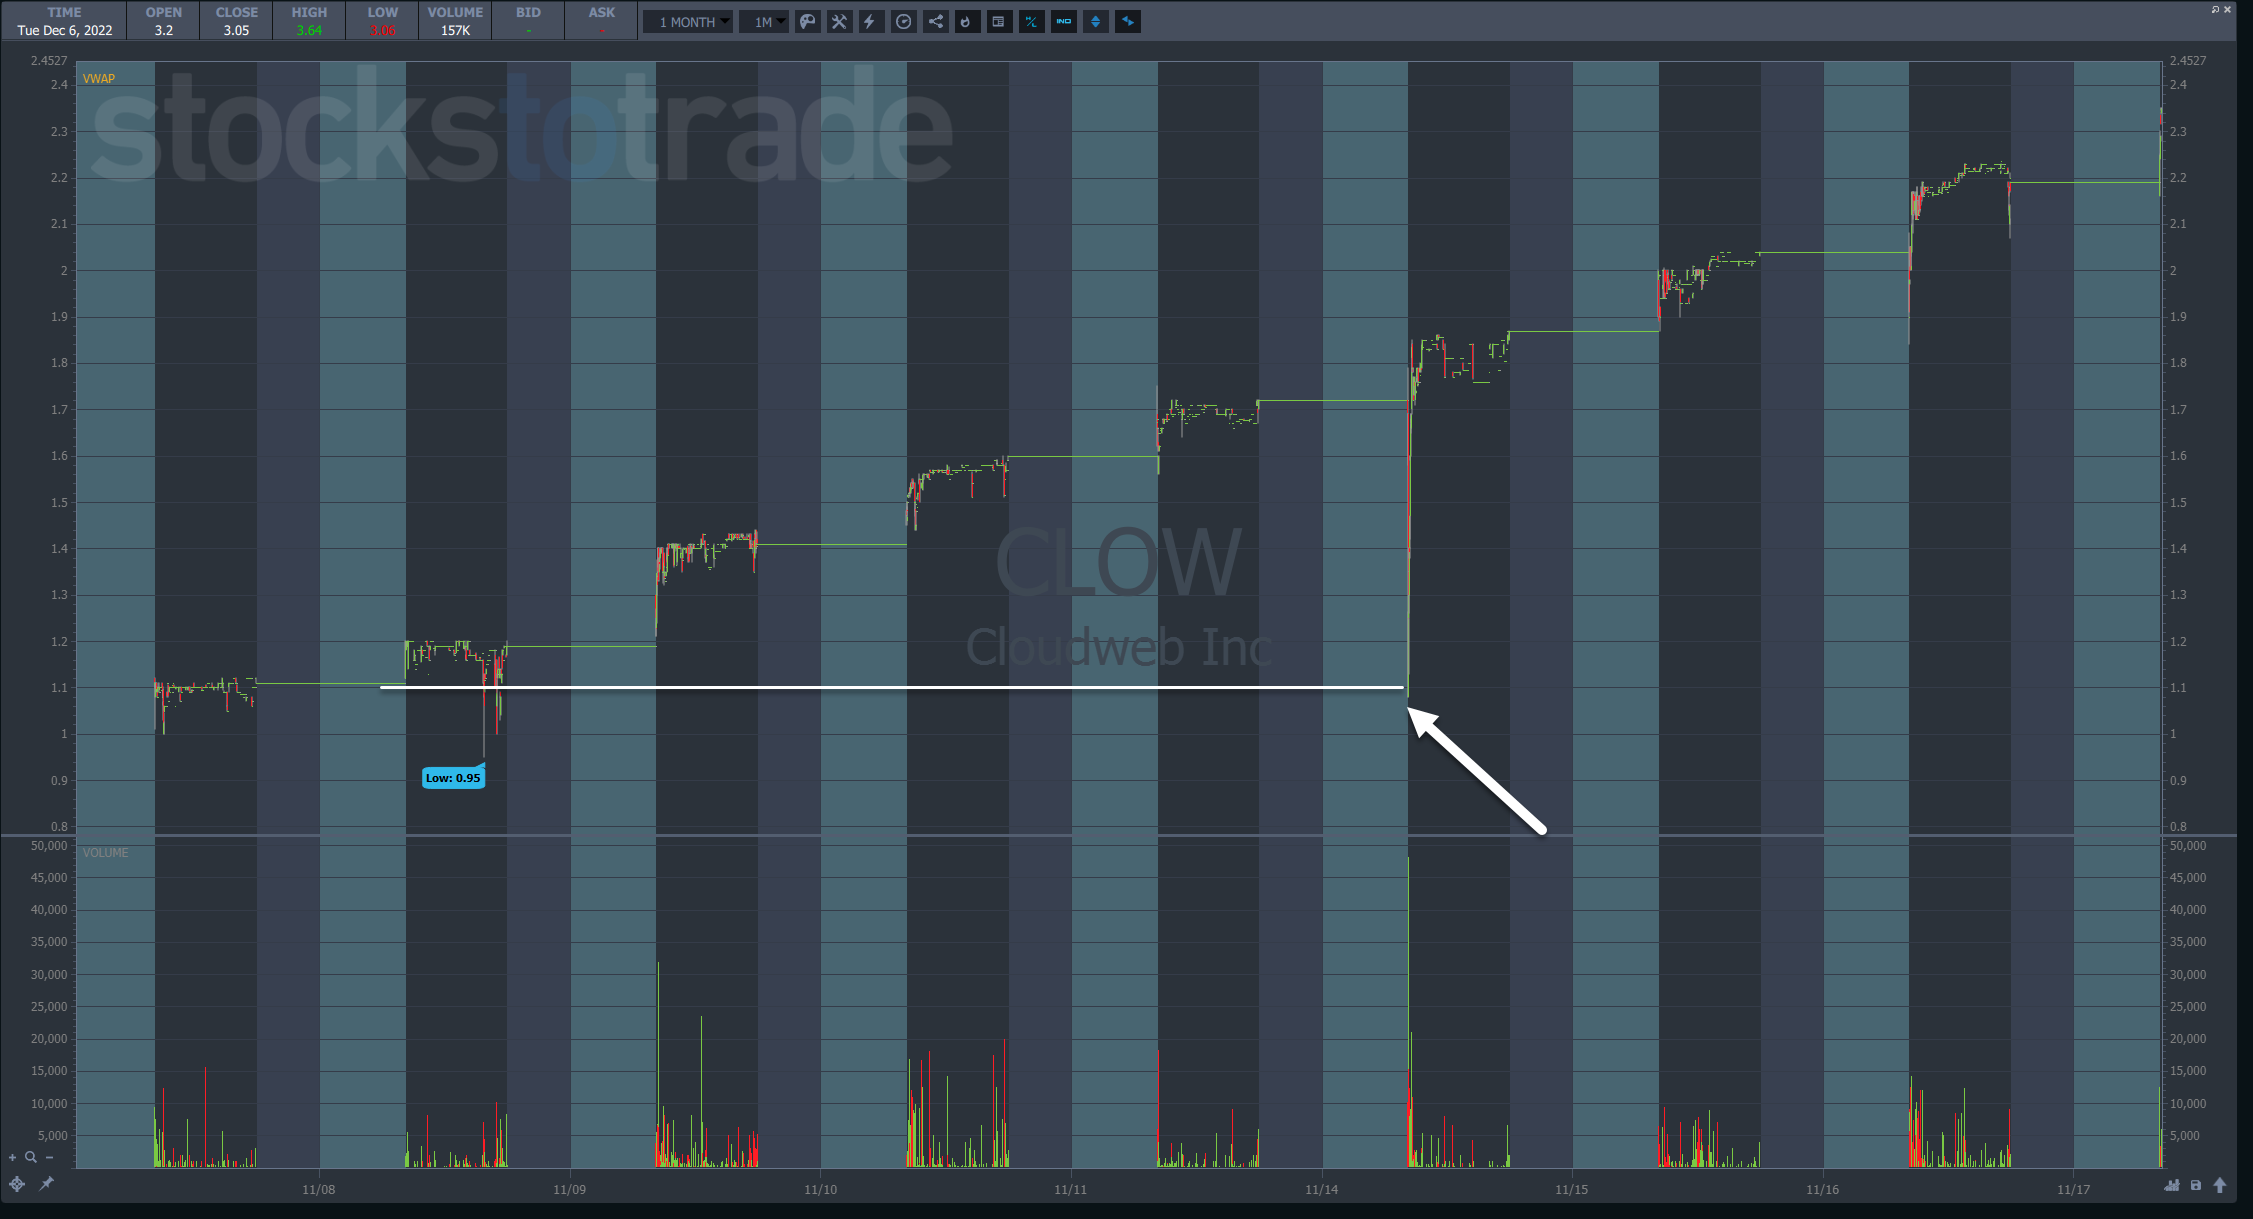
The day opened around $1.75.
Shares had already run up more than 100% from $0.75.
The massive drop, noted by the arrow, pulled back to nearly $1.00.
This was too much of a pullback too fast, especially with a solid uptrend.
Now, it can be difficult to know exactly where the stock will find support.
That’s why I like to look at the underlying price action to guide my decisions.
If we zoom in on that drop, you’ll notice a massive drop in the first two minutes followed by huge volume that reversed the momentum in the third minute.
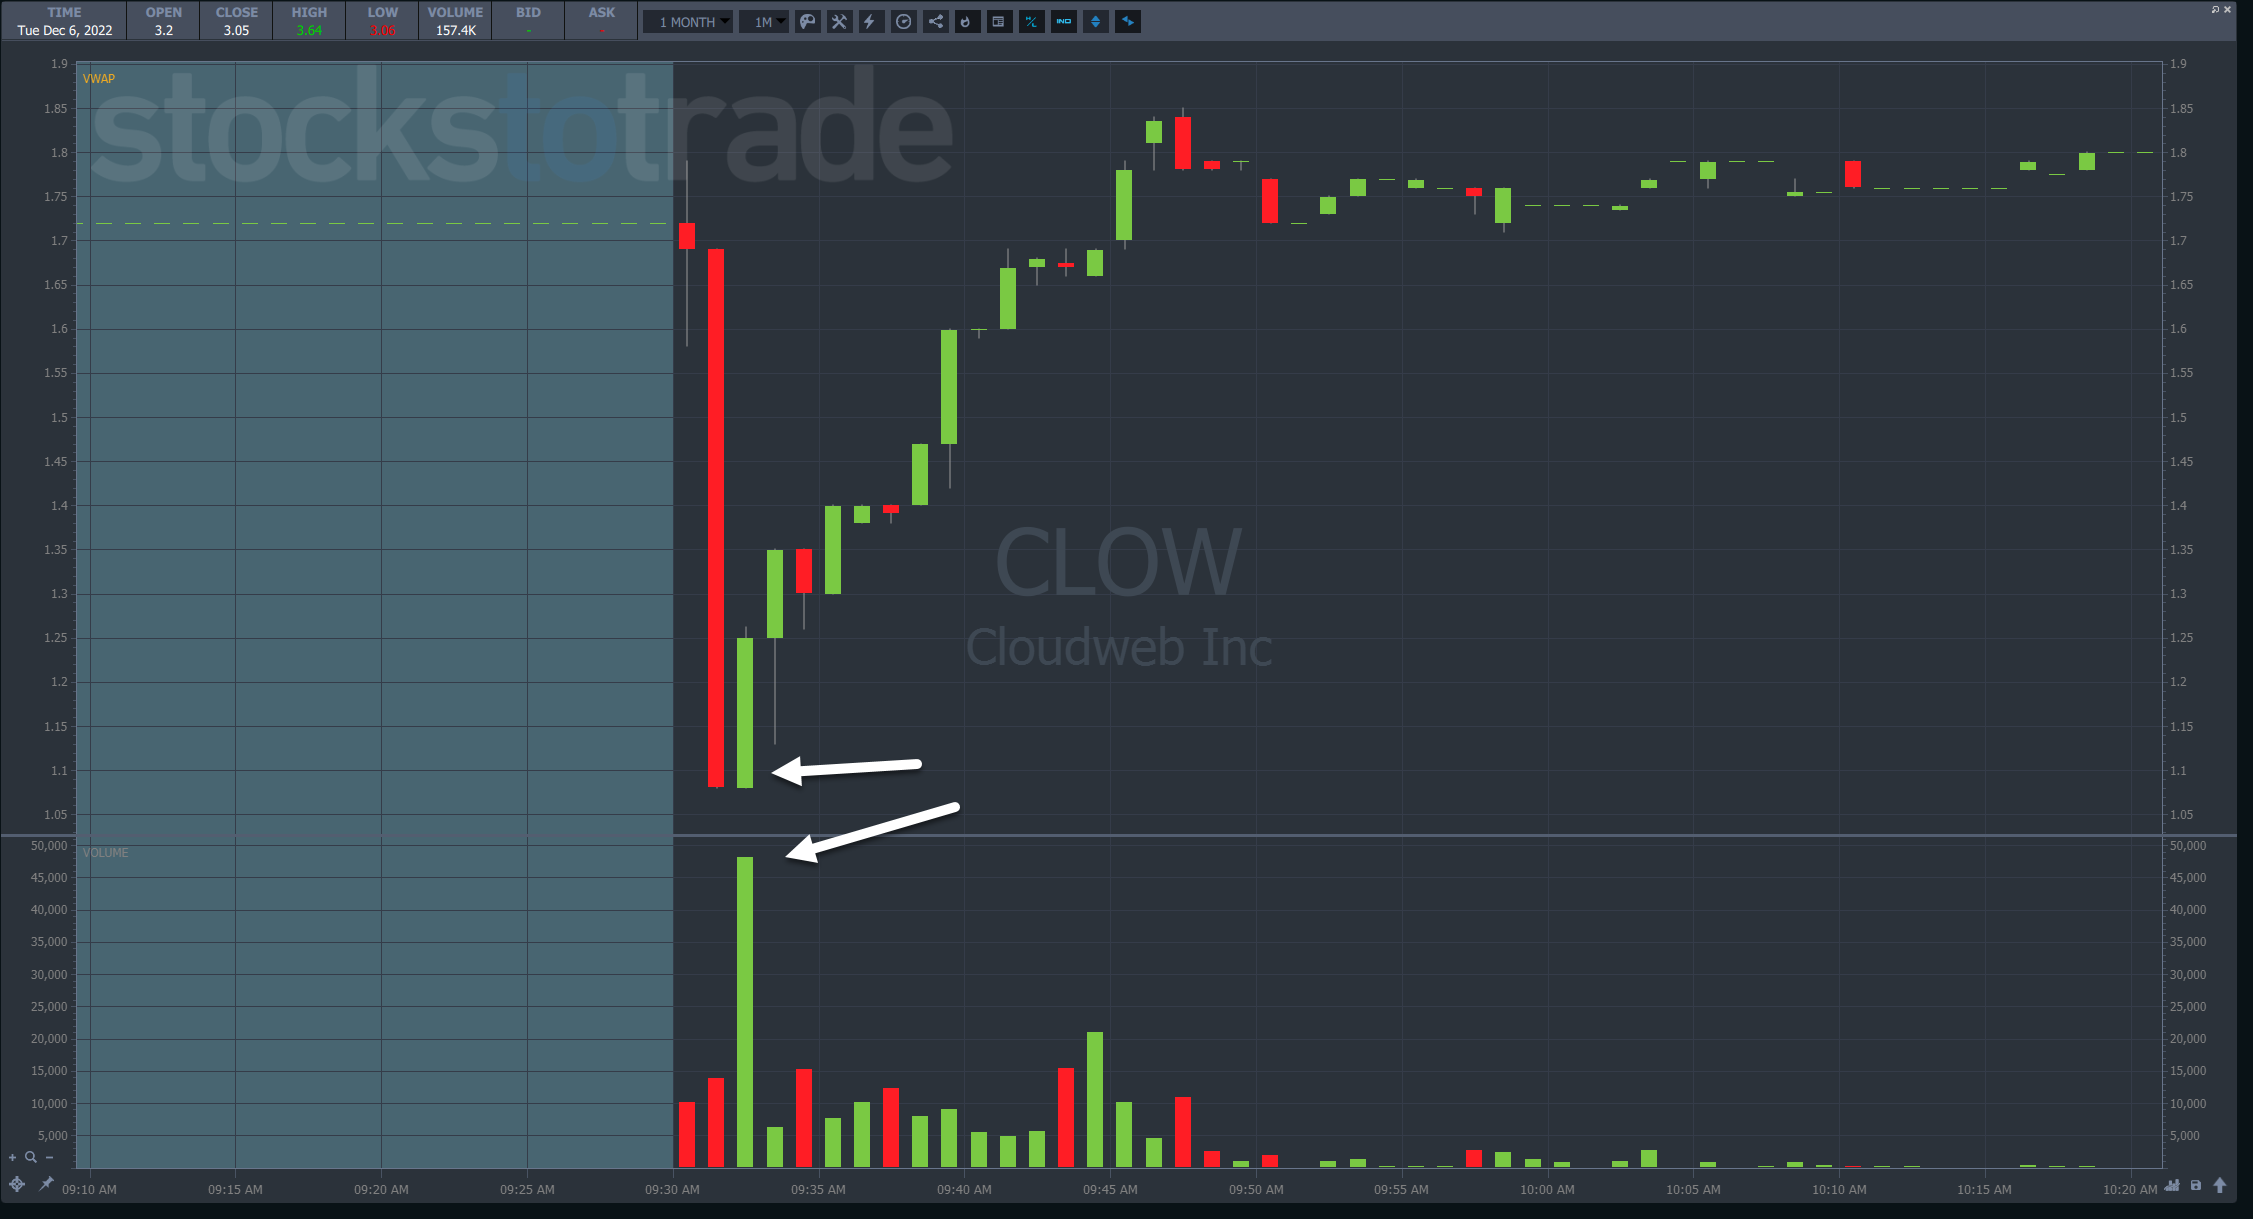
A trader could buy against the low of that candle as the stop out, roughly $0.20 below the high.
More Breaking News
- FuboTV Shares Soar After Disney Merger News
- Mercury Systems’ Stock Skyrockets: Behind the Surge
- Lucid’s New CFO and Canadian Expansion: What’s Next?
That leaves an upside potential of $0.60, assuming the stock gets back to and above the open.
Keep in Mind

2025 Millionaire Media, LLCOne stock on a multi-day run doesn’t make a trend.
Nor is seasonality guaranteed.
But when you combine the pieces of the puzzle, it forms a picture for high-probability trading.
–Tim


Leave a reply