Many new traders ask me this question … What are the best trading patterns?
There are a TON of different trading patterns out there. When it comes to what’s best, it depends on you and your trading style. Do you want to go long or short? What are your strengths and weaknesses? You must track it all.
In 2020, I stuck with a handful of trading patterns and passed $6 million in profits.* With these patterns, there are indicators. So you can learn how to spot them. If you study enough, these patterns could become part of your trading arsenal.
But some traders just can’t be convinced. Instead of trying to master these time-tested trading patterns, they wanna chase runners at high prices. This is lazy and dangerous! You gotta put the work in if you want to be a self-sufficient trader.
(*Please note: My results are far from typical. Individual results will vary. Most traders lose money. I have the benefit of years of hard work, dedication, and experience. Trading is inherently risky. Do your due diligence and never risk more than you can afford to lose.)
Now let’s get into the specifics. I won’t just tell you about my top trading patterns … we’ll talk about a bunch.
Table of Contents
- 1 What Are Trading Patterns?
- 2 Why You Should Understand Trading Chart Patterns
- 3 Trading Chart Types
- 4 How to Read and Understand Trading Patterns
- 5 9 Most Successful Chart Patterns You Must Know
- 6 Should You Know Every Trading Pattern?
- 7 What Patterns Do Day Traders Look For?
- 8 The Challenge
- 9 The Bottom Line — Do Trading Patterns Work?
What Are Trading Patterns?
Trading patterns are movements in the market that can repeat over time. With most patterns, day traders are looking for indicators. If the indicators are strong enough, the pattern might be worth trading.
A stock’s price action is on its chart. It can create shapes, trends, and other visual cues. If the same trend repeats over time, it could be considered a pattern. Some patterns have been repeating in the markets for a long time.
Trading patterns are a big part of your trading plan. Self-sufficient day traders are strict with the patterns they play. New traders should spend time practicing. Paper trading is one way to practice. Only risk real money when you have the knowledge and experience.
You gotta know what you’re doing when you trade penny stocks … Start with my FREE online guide here!
How Many Trading Patterns Are There?
I’m not sure if there’s an exact number. Depending on who you ask, you could get different answers. Like I said — when a trend repeats, it could be considered a pattern.
Bottom line: There are a lot of patterns out there.
This doesn’t mean you should try to learn them all! If you’re new to the markets, that’s like asking for trouble. Mastering a handful can be tough enough. Focus on learning a few patterns that fit your trading style. When you get some experience, maybe consider branching out.
Why You Should Understand Trading Chart Patterns

When you become good at reading charts, they can tell you SO much. The chart paints a picture of how the stock’s doing.
Some traders only trade the stock price and don’t use charts. In my opinion, that’s self-destructive. If you plan on practicing trading patterns, you’ve gotta have charts.
So, what can the chart tell you? Well, let’s talk about one of my favorite patterns … the panic dip buy. I’ll go more in-depth later, but here’s a summary…
When trading a panic dip buy, you’re looking for an overextended stock. This pattern works with stocks that make gains for multiple days. On a one-year chart, you should see several big green candles. Without a chart, it’d be tough to track this information.
When a big runner starts to sell off quickly, it can scare shareholders. This might cause them to panic out. On a chart, look for a 30%, 40%, or even 50% drop in price. If enough buyers see this as a discount, it could have a BIG bounce.
If you tried this pattern without using a chart, it’d be pretty tough. You gotta be able to see where the stock finds a bottom. Learn to visualize this pattern — study what it LOOKS like. It can be so much better than just watching the numbers.
Trading Chart Types

One thing’s for sure … charts are very important for day trading. Now let’s talk about some different chart types.
Candlestick Charts
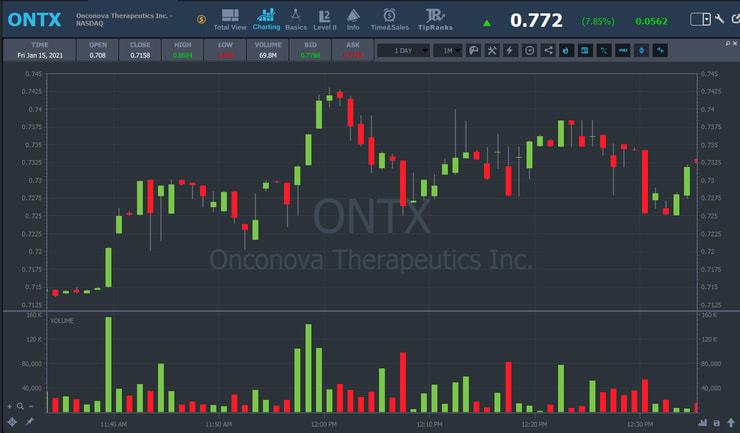
This type of chart is exactly what it sounds like. The price indicator looks like a candlestick.
When a candlestick is green, the stock price went up at that time. The bottom of a green candlestick is where the stock opened — the top is where it closed. With a red candlestick, it’s the opposite.
Candlesticks can have wicks. They’re thin lines running up or down the indicator. They represent the highest or lowest price in that period.
On a one-day chart, each candlestick represents a certain time period. You can set it to one minute, five minutes, or even higher. For beginners, I recommend one or two minutes. You should study the price action closely and learn.
More Breaking News
- CleanSpark’s Strategic Growth and Operational Success: Why Analysts Are Bullish
- Is Rigetti Computing a Falling Star or a Buy Opportunity After Sudden Plunge?
- Can ParaZero Technologies Maintain Its Momentum With Strong Q1 Performance?
Bar Charts
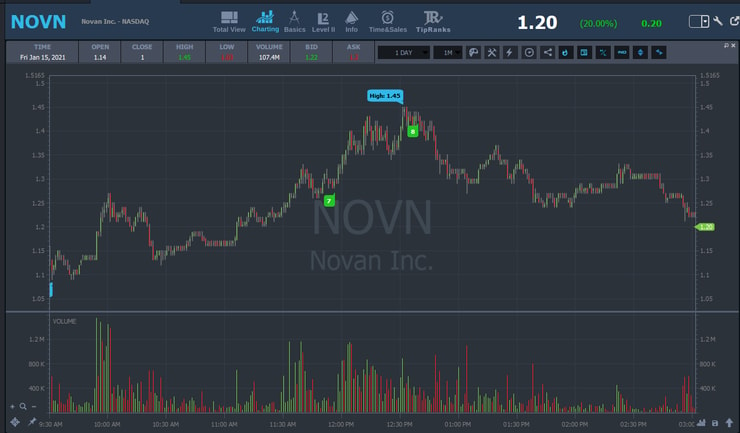
A bar chart is another self-explanatory chart. The price indicator is in the shape of a bar. It’s similar to a candlestick, but there are a few differences…
The bars have two small lines running off the sides — one on the left, and one on the right. On a green bar, the line going to the left is where the stock opened in that period. The line on the right is where it closed. On a red bar, it’s the opposite.
Line Charts
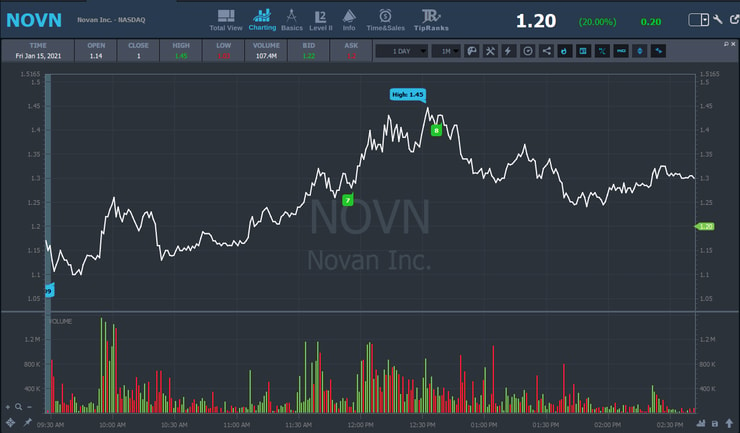
A line chart is one continuous price indicator that doesn’t segment like bars or candlesticks.
Personally, I don’t like these charts … It can be hard to read the price action. Maybe they work for you. It’s your choice. But they just don’t give you as much information as the others, so why bother?
How to Read and Understand Trading Patterns

We talked about chart types … now let’s take a look at some different trading patterns. What better way than with beautiful StocksToTrade charts?
9 Most Successful Chart Patterns You Must Know
Continuation Patterns
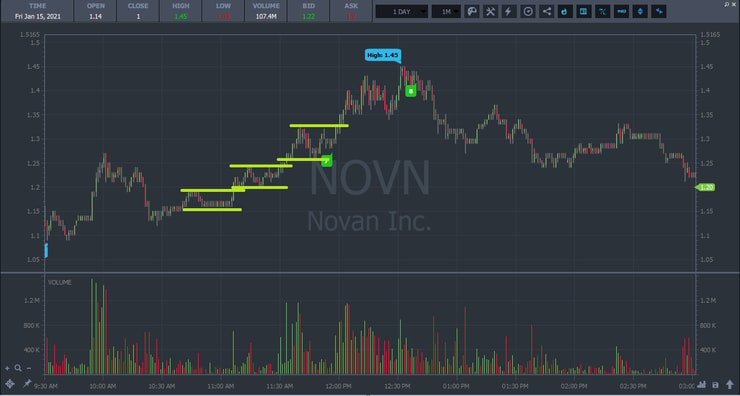
A continuation pattern is a fundamental trading pattern. You can find it in multi-day, multi-week, or even multi-year timeframes. For day trading, I’d stick with continuation patterns on a one-day timeframe.
A continuation starts with a stock that’s green and consolidating in a range. When a stock breaks out of that range and consolidates at higher prices, it’s got the technicals to be a continuation.
After the stock breaks out of the higher-priced consolidation, it can be considered a continuation.
Wedges
This is another fundamental trading pattern. A wedge can indicate that a stock’s going either lower or higher.
On a one-day chart, it starts when a stock sets a high, then pulls back. After setting a base at a lower price, the stock then spikes a bit again, setting a lower high. Then you want the price to pull back again and set a higher low.
This series of lower highs and higher lows can lead to a wedge-like shape on the chart. It can look kinda like a sideways flag.
A wedge depends on where the stock is in the bigger picture. If a wedge forms right after a stock has a breakout, it’s most likely a bullish wedge. If a wedge forms on a stock that’s overextended 200%, 300%, or even higher, it could mean that it’s a bearish wedge.
Pennants
A pennant is similar to a wedge in some ways, but it happens in a shorter time frame.
It should show a series of lower highs and higher lows, but more quickly. A pennant usually happens in the middle of a big move. The move can be up or down.
A pennant can represent a shift in the price action on a stock. It’s a short period where the stock is figuring out what it wants to do.
Be careful while playing pennants. If it’s not an A+ setup, it’s not worth your time.
Breakouts
A breakout is a very popular trading pattern. At times, it’s also one of my favorites!
It can happen in more than one way. Some occur in one day — and some can take much longer. Here’s how it goes…
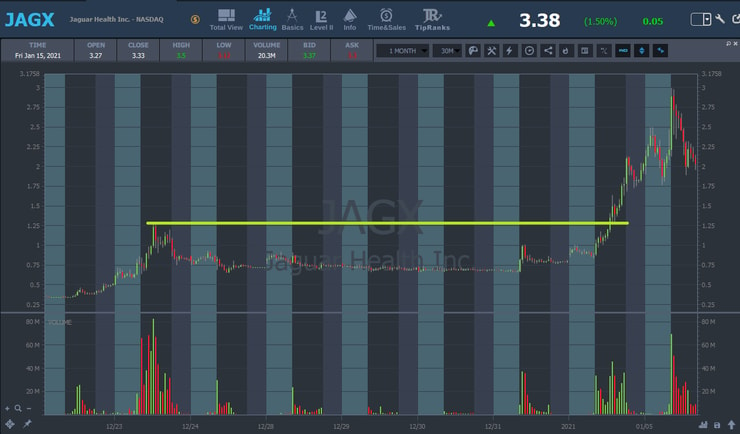
After a stock has a strong run, the price usually comes down. But people might still be in the stock at high prices. At that point, those prices are a point of resistance.
You might see the stock trading at lower prices. This is necessary for a breakout to set up. After the stock consolidates, it can start to push higher again.
When a stock is approaching a previous high level, it’s a breakout setup. When there are enough buyers creating volume, the stock can push through the breakout level. After that, it can run to new highs with less resistance than before.
But not every breakout is the same! I only play breakouts with big volume and good consolidation.
Here’s a solid example of a recent breakout over $1.25.
Reversal Patterns
A reversal pattern is typically used on the long side of trading.
This trading pattern usually happens when a stock’s consolidating in a downtrend. This means it’s creating lower highs and lower lows. You want the stock to be in a tight channel, holding the top on the bottom well.
After the stock consolidates this way, it might test the top of the channel. When it starts to break out of the downward channel, that could mean a bounce to the long side.
When all of this happens, it can lead to a reversal.
Gap
Sometimes when a stock closes strong, it can open at a higher price the next day. This is known as a gap up.
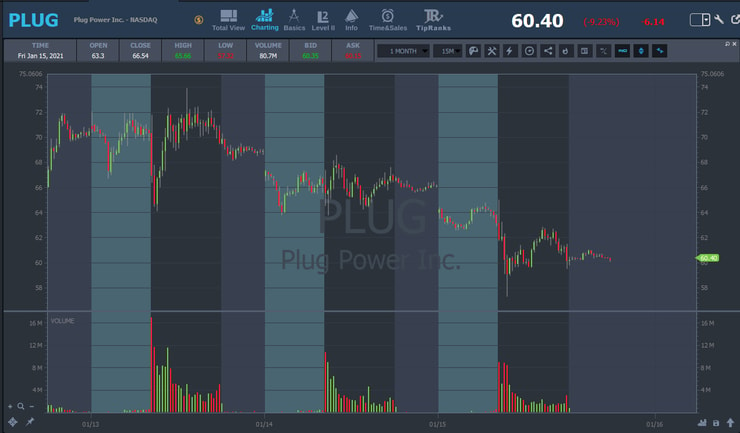
But stocks can also gap down. It can happen when a big runner gets overextended. If the stock has a weak close after several big green days, it could open at a lower price than when it closed.
Here’s an example of several gap downs on a BIG recent runner. As you can see, the price opened lower than it closed for multiple days.
Head and Shoulders
The head and shoulders pattern is pretty popular. Some traders use it to take advantage of a short squeeze. Those squeezes are what make shorting dangerous.
This trading pattern usually starts on the backside of a runner. The backside happens when the run’s over and the price action turns to mostly selling.
When a stock takes a dip from a higher price, watch for it to find a bottom. After it finds a bottom, you might see a small bounce. After the bounce, look for it to find a bottom at the same price as before. This is known as a double bottom.
When a stock fails to break through that double bottom, it can bounce higher. If shorts are stuck above, they could get squeezed out. This can lead to an even bigger bounce.
The name of this pattern is fitting — it looks like a head and shoulders.
First Green Day
I LOVE the first green day pattern. This one happens again and again.
Here’s what you should look for…
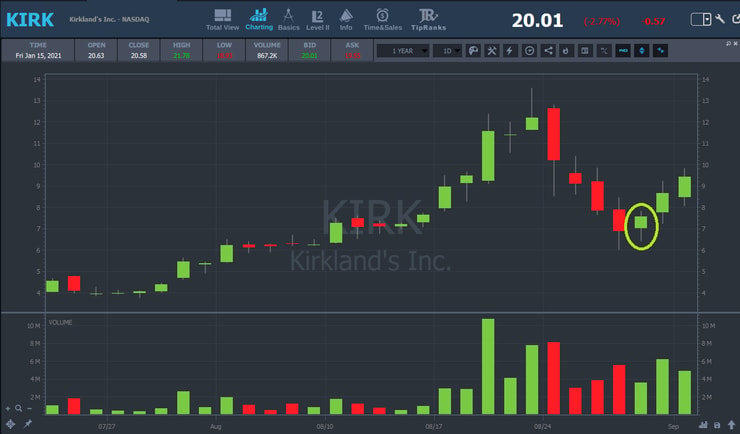
Start by finding a stock that’s had several big green days. After a big run, the stock usually has a sell-off. Buyers might think the run’s over and want to sell.
The stock will usually pull back — this is known as a red day. You want to see at least one red day, but a few are ideal.
Sometimes a stock will find a bottom after the sell-off. When the selling stops, buyers might start getting back in. That can lead to a bounce. If people are short from higher prices, this action can lead to a short squeeze.
It’s basically the first day a stock goes green after being red. These stocks have the most potential when there’s minimal selling, lots of buying, and shorts covering.
Here’s an example from a fall 2020 runner. The stock bottomed at $6, then bounced back to $8 on the first green day…
For a volatile play like this, you need to know what you’re doing. Get the “Volatility Survival Guide” now for no cost and start prepping!
Panic Dip Buy
This is one of my all-time favorite patterns. I’ve been trading it for a VERY long time now. I like it best when it happens in the morning.
Here’s how to look for it…
Find a stock that’s up a lot over several days. There will probably be a sell-off at some point. When it happens, shareholders have to react quickly. Sometimes they panic and sell.
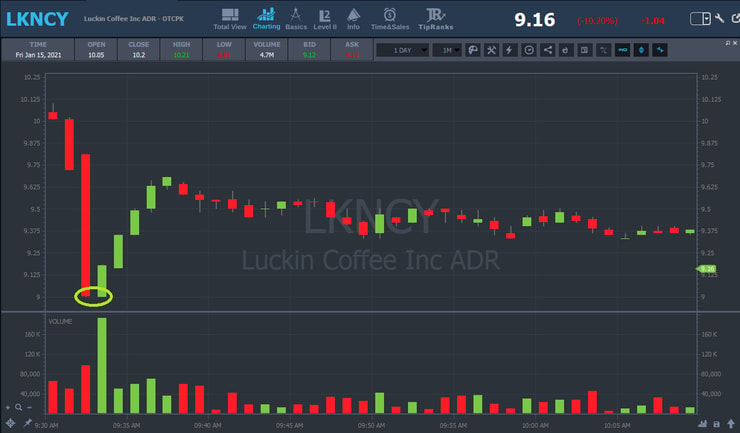
In a panic, the selling speeds up rapidly. Look for at least a 20%–30% drop. More is better. You want to see the price dive in a short time — ideally a few minutes.
This makes buyers see it as a discount. Look out for them to start piling in. Using Level 2 quotes can help you find this area. Some traders call this shift in the price action “the turn.”
With enough rapid selling and buying, the stock can bounce quickly. Sometimes, it can even bounce higher than before the sell-off. But never chase a bounce too high! Aim for the bottom. If you miss it, try again next time.
You can’t buy any stock that dips. Penny stocks can be sketchy, and some crash for a good reason. Only buy a panic dip when it makes sense. That means buyers MUST see it as a discount … not a stock that’s going to zero.
Here’s a recent panic on a big OTC runner. The stock dropped from over $10 to $9 in just a few minutes. Then it had a nice 70-cent bounce.
Should You Know Every Trading Pattern?

Some people think you need to know every single trading pattern. Nonsense.
Many great traders only use a small handful of trading patterns. They find what works best for them and stick with it.
There’s only so much time in a day. Instead of trying to learn dozens of patterns, put that effort into working on discipline. Pick two or three patterns and try to master them. Make it a rule — you’ll only trade your select patterns!
Knowing about these patterns can be helpful. But trading every pattern will probably overwhelm you, especially if you’re new to trading. Learning to be strict can be way more beneficial in the long run. Less is more.
What Patterns Do Day Traders Look For?

Traders look for all different types of patterns. You should experiment and find a few that work for you.
The best thing you can do is stay focused on your education. Learn as much as you can about your patterns of choice. Stockpile chart examples and study them!
The Challenge
If you’re committed to learning, check out my Trading Challenge. I started the Challenge so I could teach people my favorite trading patterns and so much more.
If you wanna take your trading to the next level, consider applying. But I don’t let just anyone in — I’m picky. Only the most dedicated students make the cut.
If you’re accepted, you’ll have access to TONS of learning materials — video lessons, webinars, and more.
Plus, you’ll be a part of our Challenge chat room. You can network with MANY other hardworking traders. There’s so much you can learn.
I post all my trades on Profit.ly so you can study my wins and mistakes … and potentially avoid making them yourself.
I’ve been trading for 20+ years and teaching for over 10. Several six- and seven-figure traders got their start in my Challenge and became self-sufficient by finding and honing their own trading patterns.* And you can learn from them as they now offer webinars and moderate the chat room.
If you have the dedication, the Challenge can help you develop an eye for patterns. Apply today and start your journey!
(*These results are not typical. Individual results will vary. Most traders lose money. These top traders and I have the benefit of many years of hard work and dedication. Trading is inherently risky. Always do your due diligence and never risk more than you can afford to lose.)
The Bottom Line — Do Trading Patterns Work?

Trading patterns do work as long as you’re willing to put in the effort to learn them. I’ve seen patterns repeat in the markets for years now.
When I was a beginner, no one knew about trading patterns. There were some books, but almost nowhere to research it on the internet. Now things are different.
There’s so much good material you can study. Take advantage of this … soak it all in.
Choose a handful of trading patterns that you enjoy. This is all part of your trading plan. For it to work, you MUST be disciplined.
And never give up. If you’re currently struggling, keep working hard. You never know when progress is right around the corner!
Build a solid trading foundation with my 30-Day Bootcamp! It can help you level up for a ridiculously low price. Start today!
What are your top trading patterns? Let me know in the comments!


Leave a reply