Some traders rely on technical indicators WAY too much for my liking…
But you need to know about them to become a self-sufficient trader.
If you follow me on Twitter, you know that I don’t drink the technical indicator Kool-Aid…
Everyone’s obsessed with learning all these advanced technical BS indicators, but I’ve found keeping it simple works best, just respect red-to-green and green-to-red, breakouts, breakdowns & first green days for longs & first red days for shorts, it’s CRAZY how well you can do!
— Timothy Sykes (@timothysykes) April 13, 2020
Now I’m saying that you have to learn about technical indicators? What’s up?
Listen close, because I’m about to let you in on the secret all my Trading Challenge students know…
You need to know EVERYTHING about the market.
At the same time, never lose sight of the fact that…
Only price pays.
Know everything, but keep it simple. The reason that most traders lose is that they either take shortcuts and don’t study enough…
Or they get so caught up in their ‘system’ that they ignore what’s happening in front of them.
I don’t want either one of these things to happen to you. So read on for your intro to indicators…
But remember, none of these will give you the answer for how to trade. Your best trading tool is the work you do yourself.
Table of Contents
- 1 What Are Technical Indicators?
- 2 Why Should You Use Technical Indicators?
- 3 The Types of Technical Indicators
- 4 List of 3 Technical Indicators You Should Know
- 5 Top Technical Indicators for Day Trading
- 6 How to Use Technical Indicators in Your Trading Strategy
- 7 Bonus Tip: 2 Books to Learn More About Technical Indicators
- 8 The Bottom Line on Technical Indicators
What Are Technical Indicators?
Technical indicators plug basic chart information into their formulas. They take price, volume, and open interest and predict things about a stock’s future.
Trend indicators are some of the most popular stock market indicators. As you can imagine, they can be pretty useful if you’re trend trading.
Other technical indicators have a different meaning. There are trading indicators that signal a return to average price … Others tell you whether a stock is overbought or oversold.
Still, other analysis tools look at momentum and volume.
Altogether, these market indicators comprise one pillar of technical analysis. The other parts are chart analysis and patterns … These are what I pay more attention to.
But that’s just me. I’ve made most of my $7.1 million with crap penny stocks.* Trading them doesn’t require complex technical analysis.
They’re mostly hype. And their chart patterns tend to repeat.
This is why the concepts in my “Pennystocking Framework” DVD still apply 10 years after I recorded it.* Most of the stocks I trade follow the 7-step framework my students and I still use today.
It’s included in my 30-Day Bootcamp — which can help you understand my approach to trading FAST.
Why Should You Use Technical Indicators?

Just because I don’t rely on stock indicators much doesn’t mean you shouldn’t.
My Trading Challenge students wouldn’t have thousands of video lessons to choose from if I didn’t value ALL trade tools.
I emphasize stock chart analysis because it works best for the stocks I like to trade. But I haven’t spent the past decade teaching because I want thousands of trading clones…
That’s the opposite of what I want. I got into teaching because I hate the way that the trading world isn’t accessible to all types of people.
I want you to be the type of trader you want to be. And I want to show you the best trading tools to get there.
Maybe you’re interested in higher-priced stocks, stocks that trade on the Nasdaq and NYSE. In that case, you’ll be going up against the big guns.
You’re not just going up against the traders that pile into penny stocks when there’s been news…
There are many different types of market participants in major stocks like Apple.
Some are short-term traders like me. But then there are actual investors, and their motivations can greatly differ. They’re not after singles…
And they can knock your trading plan for a loop.
If you’re trading these stocks, you might use technical indicators for your trading. But even in penny stock land, understanding the types of indicators is essential.
Why? Because other traders use them.
This is the kind of big-picture approach I teach in my Trading Challenge. I want you to prepare and then prepare some more.
This is why I don’t accept everyone to the Challenge. But if you think you’ve got what it takes, apply here.
The Types of Technical Indicators

There are a number of ways to think about indicators.
You can look at them for what they’re supposed to predict. Moving averages are trend indicators. The relative strength index (RSI) is a relative strength indicator.
You can look at whether an indicator is lagging or leading. Lagging indicators give historic context to the current price. Leading indicators attempt to predict future price movement.
I’ll break them down in the simplest way I know how — into oscillators and overlays. Overlays fit over a trading chart. Oscillators get their own indicator charts above or below the price chart.
Overlays
Overlays operate on the same scale as a stock’s chart. These indicators will often smooth price data to give you a clearer sense of the trend.
Overlays can give you a quick, visual idea of how a stock’s price compares to its trend. They are sometimes called ‘trend following’ indicators.
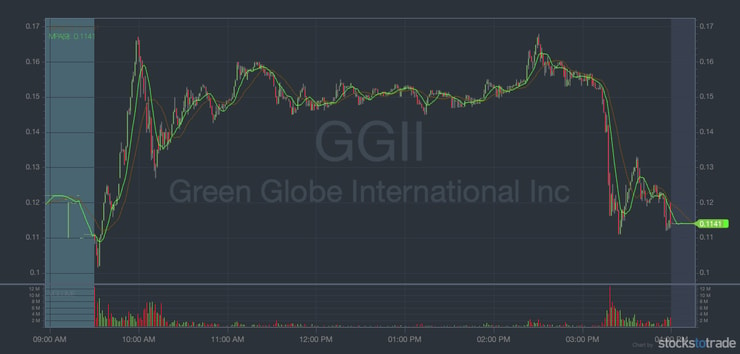
When a 50-day simple moving average (SMA) plots above the 200-day SMA, the trend has been positive.
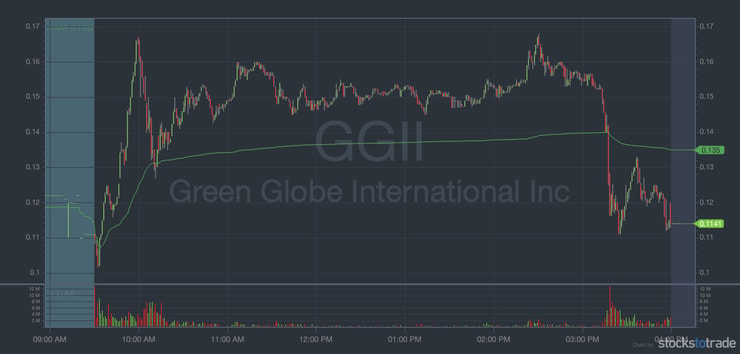
Other overlays can figure into your trading plan in a quick and practical way. VWAP (volume-weighted average price) shows you the average price that most of a stock’s shares traded for that day. This gives you a quick idea of whether most day traders are making or losing money.
You can use this indicator in several ways. Some traders set their risk at VWAP — as long as the price stays above that line, other traders are still in the green.
Because of this, VWAP can indicate support when the price is above it. Or it can signal resistance when a stock’s price is below.
Oscillators
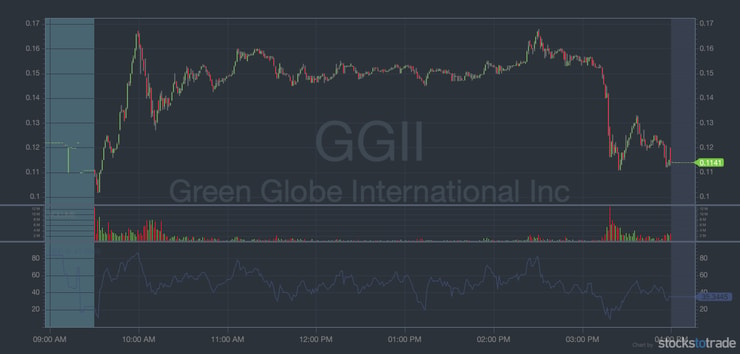
The other type of technical indicator is the oscillator. These are the indicators that appear in a little window below the price chart.
They’re also called range-based indicators because they don’t follow a trend. They’re useful in choppy markets when a trend hasn’t been established.
RSI is one of the most popular oscillators. When a stock is overbought, this oscillator displays a high reading. The opposite also applies.
When a stock is overbought, that could be an early market trend reversal signal. Buying volume has been diminishing, and this puts buyers in charge of the market. Sometimes — but not always — this will precede the stock price’s downtrend.
When oscillators work for your trading, you can feel like a technician. But remember — only price pays!
List of 3 Technical Indicators You Should Know
I won’t give you an obscure technical indicators list. It isn’t about knowing the ‘best’ technical indicators…
It’s about knowing the best stock indicators for your trading style.
There’s one more thing when it comes to using technical indicators in your trading. You want to know what other traders are thinking too.
The market is filled with all different kinds of traders. Some traders hold and hope. Others chase. Some cut their losses quick — like you should.
It’s impossible to know other traders’ motivations. But you can know the indicators that other traders look at…
Here are some of the most common ones.
More Breaking News
- Battalion Oil Surges After Major Midstream Agreement
- Sezzle Inc. Prepares for Q4 2025 Earnings Amid Leadership Transition
- Fabrinet’s Target Price Raised Amid Strong Q2 Performance
- Rivian Appoints New Chief Customer Officer for Enhanced eCommerce Strategy
Moving Averages
The moving average is a foundational technical indicator. It’s one of the most widely used technical indicators.
It smooths out price charts, more cleanly showing support and resistance levels.
Traders will often use the cross of slower and faster moving averages as a market signal to buy or sell.
Does it work? Sometimes.
The thing to know is that this indicator can only work for a trend-following strategy. Because it’s working with past price data, it can only show you how the trend has changed in the past.
Sometimes this can help your technical analysis of developing stock trends. But other times it will leave you chasing the market.

VWAP
As I said before, VWAP can be a great resource.
Why? Because the rest of the market uses it.
This indicator looks at where most of the volume entered a stock on the day. This lets you know whether new traders are making or losing money.
But it’s not foolproof. You can’t know the risk levels for these new traders … and you don’t know their strategies either.
Some might hold onto the stock for 20 years. Others will hold it through a downtrend, convinced that it will go up.
The important thing is that the market believes in this indicator. Because of that, it needs to be on your radar.

RSI
This is another indicator that falls into the ‘traders believe in it’ category.
It’s perhaps the most popular oscillator. This is an important practical consideration. It won’t clutter your chart, especially if you already have an overlay or two on it.
It’s also a leading indicator, which points to future price trend shifts. Some traders use RSI with a lagging indicator like the moving average. The lead indicator provides a signal of a shift in market trend, and the lagging one confirms it.

Top Technical Indicators for Day Trading
Traders vary on the best indicators for day trading. I’ve run down some of the most popular ones already…
The most important difference is how you use them.
Moving averages can work for both long-term and short-term positions. But there are important differences.
A 50-day SMA crossing a 200-day SMA might tell you something about the long-term trend…
But a 9-minute SMA crossing a 20-minute SMA is probably the better day trading signal.
Which is the best moving average for day trading? I can’t tell you that. So many other factors come into the equation.
Is the stock spiking? This lagging indicator may be late to the play, and you’ll end up chasing. And that’s never a sound strategy.
Is the solution to use leading indicators instead?
RSI won’t tell you anything in advance about a shift in a stock’s trend brought on by a news catalyst.
VWAP is one of the most valuable as a day trading indicator … it resets each new trading day.
But again, it won’t tell you anything that’s not already in the chart.
How to Use Technical Indicators in Your Trading Strategy
Some traders will team a leading indicator with a lagging one for confirmation…
Others use technical indicators to chart support and resistance…
And others use indicators for risk…
There are as many ways to use indicators as there are ways to trade. The key is to experiment.
Get yourself a robust trading platform like the one I use, StocksToTrade.** Any platform worth its salt will have an array of indicators ready to go.
Also important to note … StocksToTrade keeps its charts clean — even with all those indicators!
It’s got an awesome stock screener designed by actual traders like me. The news scanner has saved me weeks of my life. It puts all the sites I used to search manually in one place.
See if it fits your trading style. Click here to get 14 days of clean charts and powerful scans for only $7!
Bonus Tip: 2 Books to Learn More About Technical Indicators
If you’re asking for my favorite technical indicators book, it’s not all about indicators…
Check out Brian Shannon’s “Technical Analysis in Multiple Timeframes.” Shannon keeps his focus on charts but uses indicators where they make sense.
(As an Amazon Associate, we earn from qualifying purchases.)
He’s partial to moving averages and VWAP. But he never gets bogged down in the signals these indicators deliver.
Listen to him dismiss the debate between simple vs. exponential moving averages:
“Because we’ll examine the moving average as a mere reference point to which price is compared — and not a system — there is no particular advantage to using one over another.”
This is exactly my take on indicators. We’re using them as confirmation, not as the basis for a trade.
Indicators can give you a clearer idea of where the price is going … But with enough screen time, so can a price chart.
If you want to see my take on technical analysis, read my student Jamil’s book, “The Complete Penny Stock Course.”
Jamil’s done the impossible. He’s taken my 20+ years of trading experience and squeezed it all into a single book!
It’s not all about indicators either. It focuses on the bigger picture that indicators should contribute to.
The Bottom Line on Technical Indicators

I hope this article gives you some perspective on technical indicators…
But you need to know as much about them as me before you get the right to ignore them.
So start studying. There’s a line between trading simple and being ignorant…
You might even find some indicators there.
How do you use indicators? Which are the most valuable ones to you? Let me know in the comments — I love hearing from my readers!
Disclaimer
*While Tim Sykes has enjoyed remarkable success trading stocks over the years, earning an aggregate sum of over $7 million in trading profits between 1999 and 2021, his primary income derives from the sale of financial education products and subscription services offered by various businesses and websites in which he has an ownership stake.
This level of successful trading is not typical and does not reflect the experience of the majority of individuals using the services and products offered on this website. From January 1, 2020, to December 31, 2020, typical users of the products and services offered by this website reported earning, on average, an estimated $49.91 in profit. This figure is taken from tracking user accounts on Profit.ly, a trading community platform.
**Tim Sykes has a minority ownership stake in StockstoTrade.com.


Leave a reply