Technical indicators are some of the handiest tools in a trader’s repertoire. But why exactly, and which ones should you use?
As for why … by using different indicators on stock charts and combining it with your careful fundamental analysis, you can get a better snapshot of the stock in question, allowing you to make a more deliberate and intelligent trading plan.
As for which ones you should be using … ultimately that’s up to you, but it’s important to educate yourself on some of the big ones so that you can make that determination. Today I’ll offer up an introduction to a super popular indicator: the relative strength index.
In this post, I’ll explain what the relative strength index is, why it matters, and how traders use it as part of their technical analysis. In gaining a better understanding of an important indicator like this, you’ll be better able to make good use of the information it offers.
Table of Contents
What is the Relative Strength Index?

Most frequently referred to as the “RSI” in the trading sphere, the relative strength index is an indicator that helps you figure out how a stock’s losses and gains stack up against each other.
The RSI is an oscillating metric, meaning that it will change based on the most recent price action of a stock.
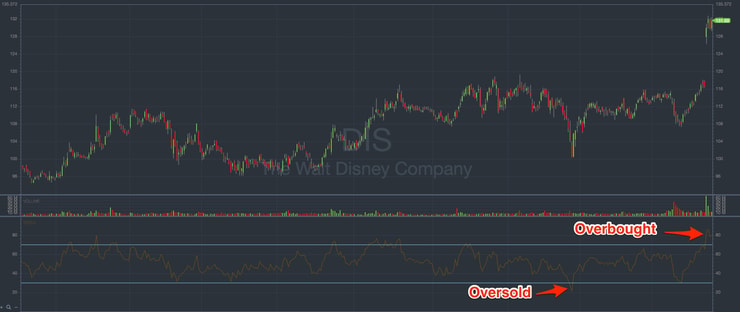
The RSI is shown on a scale from 0 through 100. A low RSI can show signs that a stock is underbought, and a high RSI can show signs that it’s overbought. This can help you find signs of breakouts or breakdowns, and can be used to help confirm trends.
Perhaps best of all, RSI is easy to include in your technical analysis, since it’s a standard indicator on a bunch of different stock screeners, including StocksToTrade.
Trading The Relative Strength Index
Now that you understand the basics, how is the RSI calculated and how do you actually use it? Let’s explore.
How to Calculate RSI
The good news is that you don’t need to know how to calculate the RSI, because most stock screeners will do it for you automatically. However, it can be helpful to get an overview of how it’s calculated just so that you understand it a little bit more. So let’s go into it, but don’t worry about memorizing it!
The basic equation used is this:
RSI = 100 – 100/1+RS
The RS from that equation is calculated like so:
RS = Average Gain / Average Loss
Tips on Using RSI
To make the most of RSI in your trading, keep these things in mind:
Overbought Versus Oversold: What’s the Difference?

To make the best use of the RSI, first take a few minutes to educate yourself on the meaning of overbought versus oversold. They’re pretty much what they sound like, but just for a little infusion through repetition, here’s the definition of each term:
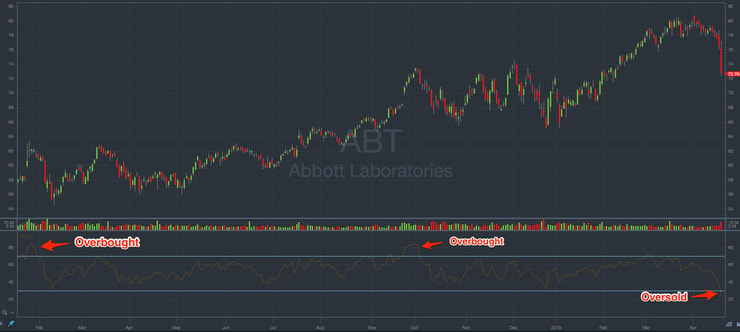
Overbought: This term refers to a time period where there’s been a consistent upward trajectory with a stock, without many pullbacks. Put simply, the stock’s price is rising without too many dips.
While on the one level this is exciting, it falls under the age-old wisdom of “what goes up must come down.” It’s not common for a stock to maintain this sort of action for too long without experiencing a correction or falling eventually.

Oversold: This term refers to a time period with a consistent downward trajectory in a stock’s price, without many upward jumps. Basically, it’s the opposite of overbought. Sure, some stocks will just continue into oblivion, but based on your research, you might determine that there’s room for it to grow.
Generally, with the RSI, a number of below 30 is considered oversold and over 70 is considered overbought, where the range of 30-70 is neutral or no trend.
However, this isn’t always the absolute gospel. Some traders might consider expanding or tightening the parameters based on their style and trading experience. Make notes of the RSI in your trading journal and over time you can get a handle on what ranges work for you.
More Breaking News
- Rivian Automotive’s Stock Surge: Will It Continue or Fizzle Out?
- Archer Aviation’s Unexpected Surge: What’s Fueling the Takeoff?
- Is Rail Vision’s Stock Set for a Surge Following Major Milestones?
Rely on Multiple Sources
Like any other technical indicator, the RSI should not be seen as the be-all end-all. It should be used in combination with other technical indicators and a combination of fundamental research to make a case for your trade.
Be smart! Don’t just blindly trade based on the RSI calculation. Decide on the viability of a trade based on a variety of different factors.
Use it to Find Entry and Exit Signals

Rather than looking at the RSI as a definitive sign of whether you should take a position in a trade, consider it a helpful way to plot out potential entry and exit signals for stocks on your watchlist.
Part of the idea behind the RSI is that when prices rise quickly and momentum is high, that eventually the stock in question will be considered overbought. This could help inform when to sell.
The opposite could also be true: A price dropping in a short term and low momentum could offer a potentially opportune time to buy.
Bottom line here: If a stock is already on your watchlist and you’ve been waiting for the right time, the RSI can help you decide when.
Beware of False Signals
Like any other indicator, the RSI has its imperfections. One is that can’t specifically discern a divergence between price and momentum.
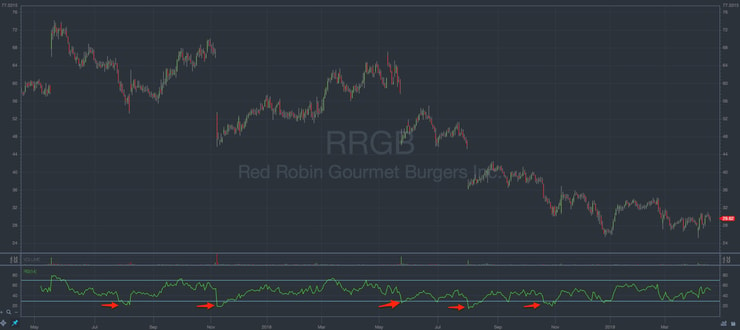
A strong uptrend or downtrend could keep the RSI above 30 or below 70, for example. In this case, if you’ve been waiting for the RSI to reach a certain level, you could be left in the lurch.
This is why you want to use the RSI as only one piece of your puzzle when building a case for a trade. It doesn’t tell the full story, and you need to learn to think for yourself so that you can use these numbers rather than just relying on them. For example, you might find by looking at the RSI but then waiting for a pullback is a strategy that works well for you.
RSI and Stochastic Oscillator
The RSI is often confused with another indicator called the stochastic oscillator, so let’s take a minute to discuss the difference.
What are Price Momentum Oscillators?
But of course, before we go into the stochastic oscillator, we need to back up a little further still, because you need to understand what a momentum oscillator is, to begin with.
A price momentum oscillator is a measure between the amount that a stock’s price has changed within a period of time.
The stochastic oscillator is a specific type that compares the stock’s losing price against its trading range over a time period. The number is expressed between 0 and 100, and it’s usually shown along with a SMA (simple moving average) of itself.
The standard number of periods for the stochastic oscillator is 14. So if you’re looking at daily candlesticks, it will be shown as SO(14) on a chart. If you’re looking at minute candlesticks, it will be based on the last 14 minutes.
So what does the number mean? If the number is between 0 and 50, that means the stock closed in the lower part of its trading range. From 50 to 100 means it closed on the higher end of its trading range. The closer to 0, the closer to its low; the closer to 100, the closer to its high.
Like the RSI, the stochastic oscillator is used to figure out a stock’s momentum, and is also used to figure out if a stock is overbought or oversold.
The Difference Between RSI and Stochastic Oscillator
So, the RSI and the stochastic oscillator might sound fairly similar so far, so what’s the difference?
While they’re both used to figure out momentum, they use different information. The RSI uses volatility as its base of calculation, where the stochastic oscillator uses closing prices.
Additionally, the RSI is usually standard as a stock screening tool, and you’ll easily find it on StocksToTrade. The stochastic oscillator is more likely to need to be done “manually” — read this post to figure out all you need to know.
Finally, the numbers can be different. With the stochastic oscillator, below 20 is considered oversold, and above 80 is considered overbought, as opposed to the 30 and 70 with the RSI.
Trading Challenge
Indicators are great, but they won’t do you much good if you don’t understand what they mean or how to use them.
You wouldn’t use a power tool without first learning how to use it and considering what your goals are for a home repair project. Similarly, to really make the most of the tools in your trading toolbox, it’s important to forge a strong foundation of trading knowledge and to get clear on your trading goals.
There’s no shame in admitting that you need guidance — in fact, it’s commendable, because so many traders are too proud to seek out the education that they so sorely need and ending up losing big because of it.
My Trading Challenge could be just the solution you’re looking for. In the Challenge, I’m not just offering you things to memorize or rote basics. Yes, you’ll learn the basics of course, but my goal is much bigger: to help you become a trader who can think for yourself.
In the Challenge, you’ll have access to an incredible library of lessons and videos that will educate you on everything from penny stocks to my favorite trading patterns to technical indicators and more. You’ll also have access to webinars, live trading, and my weekly watchlist.
But even more, you’ll be surrounded by a community of like-minded and ambitious traders. When you have a community, you’ll have more accountability — and more inspiration to succeed.
Conclusion
The RSI is a popular indicator with good reason. It has stood the test of time as a relevant and helpful indicator of trends, and can help support your stock research when deciding to make a trade and working to determine entry and exit points on your trading plan.
However, like all technical indicators, the RSI should never be the sole deciding factor about whether or not you enter a trade. You need to carefully consider the stock’s price action, look at a variety of technical indicators, and perform detailed fundamental research.
It’s by being extremely and painstakingly thorough in your research that you’ll be able to get the biggest picture look at the stock and make the most intelligent trading decisions.
How do you use the RSI in your trading? Leave a comment and let me know your experience!


Leave a reply