A put option is, simply “put” (pun intended), a way to bet that a stock will drop in value while limiting your risk.
Once you’ve been in the market for a while, you’ll likely start to hear new terms. You may find yourself asking, “what’s a call” or “what the heck is a put option?”
Don’t worry if you don’t know … not many people outside of the markets understand these complex trades.
Today, I’ll explain what a put option is.
Options are a way for traders to make bets on what they think the underlying stock will do in the future.
For today’s purposes, I’ll limit the discussion to stock put options to keep it simple.
I’m a penny stock trader and educator. Full disclosure: I don’t trade or teach options. But I think it’s worth reviewing so you better understand the overall markets. Let’s dive in.
Table of Contents
What Is Options Trading?
If trading stocks is checkers, trading options is 3D chess. Options provide more complex ways to profit and hedge (limit your risk) your bets.
Unlike the S&P 500 which trends higher over time, options become less valuable over time. As they come closer to their expiration date, they “decay.” So you only have the potential to turn a profit when the option is traded.
You can’t buy and hold options, expecting they’ll rise in value over time. They literally have an expiration date.
Options typically aren’t good for day trading. either. The value doesn’t move unless the stock price moves. Now, let’s get into the details…
What Is a Put Option?
A put option is a contract between a buyer and a seller to transact at a certain price, known as the strike. The contract is good until the expiration date. After the expiration date, the contract ends and the buyer and seller owe each other nothing.
The example below is from Tesla Inc. (NASDAQ: TSLA) and shows a strike and expiration. These are key components of options contracts.
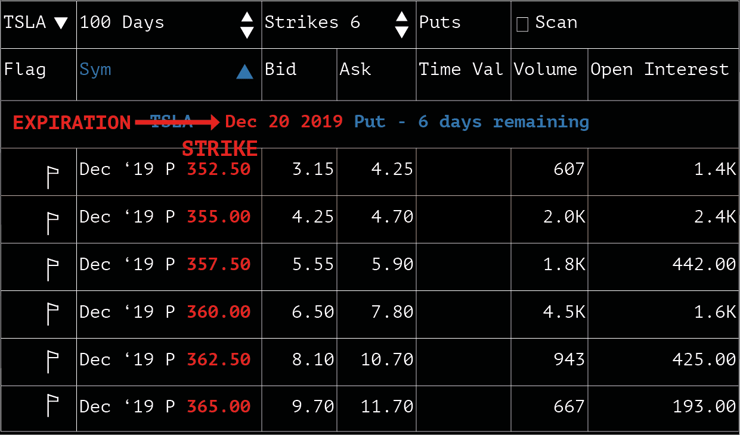
The strike is the agreed-upon price at which the seller of the option contract must buy the stock from the buyer of the put option contract. The seller of the contract becomes the buyer of the stock.
The expiration is the last day the buyer of the contract can exercise the right to sell the stock at the strike price. The buyer of the option is under no obligation to actually sell the stock short.
In the example above, let’s say I bought the option with a strike of $355. If the price of the stock was to fall to $345 on or before December 20, 2019, I can exercise my right to sell short the stock for $355 to the seller of the option contract.
I could then go onto the open market and buy back the stock for $345. Or I could hold the stock in hopes of a further decline. Once I cover my position, I keep the difference as profit.
The Difference Between Call and Put Options
Calls and puts trade the same, but they take the opposite side. The difference between call and put options is the direction in which the buyer thinks the stock will move.
With a call option, the buyer’s betting the stock will go up. A put option is the opposite — the buyer thinks the stock will go down.
In both cases, as a buyer, your risk is limited to the premium you pay when you buy the contract.
The difference lies in what you expect the stock to do. If you expect the stock’s price to fall, you can buy put options and make money if you’re right. If you expect a stock’s price to increase, and if you’re right, you can profit.
As a buyer, the premium you pay for the contract is your maximum risk — no matter what the stock does.
How Do Put Options Work?
So far, we’ve talked about the overview of what options are and how you can profit from them. The actual execution is more complex.
The above chart of TSLA options prices shows the price for one share. But options contracts trade in lots of 100 shares each. That’s important to remember … Buying options is very different from buying stocks.
When you’re trading, you can find a stock for $5 per share. You can place an order for one share for $5, or 100 shares for $500, and so on.
When buying options, if the premium is $5, you buy one contract of 100 shares for $500. Every time you see an option contract premium, you must multiply by 100 to get the price you actually pay.
The contract seller always keeps the premium and always starts off in the lead. The buyer always starts out in the hole.
Since you pay the premium, the seller gets the cash from the transaction while waiting for the contract to expire.
Most major brokerages offer options trading, both buying and selling. They also charge a commission for each transaction.
Buying Put Options
Buying a put option means you start from behind and try to predict a future price decrease.
Buyers pay the premium to the seller and a commission to their brokerage. The buyer needs the price of the underlying stock to go below the strike price to be in the money. And they need the price to drop below the strike price enough to exceed the cost of the premium and commissions they paid to turn a profit.
Let’s go back to the TSLA example. Let’s say I pay a $4.70 premium for the put with a strike price of $355. I need the price to decline to about $350 to break even.
If the price fell further to $340, I’d make $10 per share. This is where options can really pay off. If the price was to fall to $300, I’d make $50 per share. On a 100 share option contract, I could make $5,000 while only risking $500.
More Breaking News
- Datadog Soars with Strategic Price Adjustments Amid Optimism
- Coca-Cola’s CEO Sells Shares: Market Reactions and Financial Insights
- Vizsla Silver Shows Resilience Amid Unsteady Market
- China SXT Pharma Launches AI Supply Chain Overhaul for TCMs
Writing Put Options
If there’s a buyer, there must be a seller. Options sellers are also known as writers. They essentially write the contract and put it up for sale.
The seller seemingly takes a position of lower risk. But much like shorting a stock, when you write a put option there’s no maximum risk when you sell it. Once you sell put options, you keep the premium no matter what. Until the contract expires, the seller must buy at the strike price even if the current price is now far below the strike price.
Keeping with the TSLA put above, the writer sold a put option for a premium of $4.70. It’s up to the buyer to decide the best time for exercising a put option. If the price drops to $300 and the buyer decides to exercise his option, the writer must buy at the strike price.
The contract writer must pay $355 for a stock that’s only worth $300 on the open market.
Selling options, much like shorting a stock carries a huge potential risk.
Selling Put Options
As the expiration date nears, the option price declines since the chance of a big drop goes down as the date draws closer.
Sellers are the writers — they write and sell the contract to the buyers. Sellers have more than one way to profit, but their profit is limited to the premium the buyer is willing to pay.
A seller sells a short put position. At any point, a seller may cover a position by buying another put option with the same strike and expiration. This works the same as covering a stock that you shorted.
FOR EXAMPLE, say I sold the premium we talked about before for $4.70. As the expiration date nears and the stock price holds steady above $355, the premium would decline. That’s known as time decay. If the premiums fall to $2, I could buy at the price to lock in a profit and keep the difference of $2.70.
If I didn’t buy to cover my position and let the contract expire with the stock price at or above $355, I’d keep the entire premium. I’d make a profit of $4.70 per share of the contract.
The seller of an option contract can make money when the price moves sideways. Every other trader in the market needs the price to move to make a profit. When the price stays the same, sellers keep the premium and receive the put option payoff.
Put Option Examples
Here are a few basic examples of put options and what needs to happen to turn a profit.
Example 1
Check out the chart of Beyond Meat, Inc. (NASDAQ: BYND) puts below.
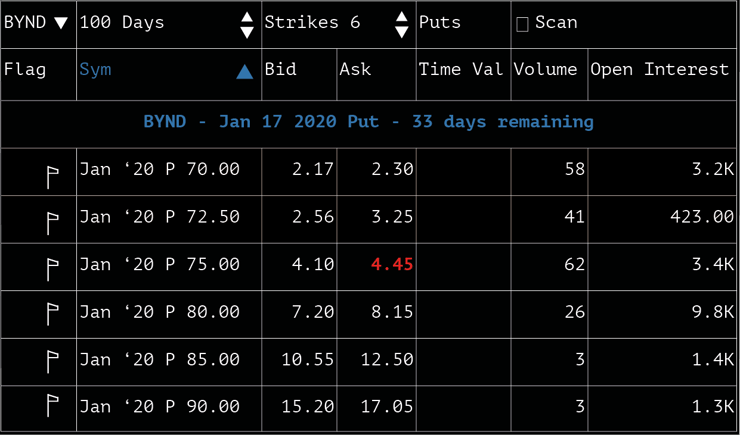
On December 13, BYND closed the day around $75. If I’m convinced that the price will drop further in the next month, I could buy a put options contract for $445 total.
When the price reaches $70.55, I’d break even. If the price drops lower, I’d make the difference times 100. So if the price continues to $60, I’d make $10.55 per share or $1,055.
But if the prices stay above $70.55 until January 17, I’d lose money.
Example 2
Look at the chart of Netflix, Inc. (NASDAQ: NFLX) puts below.
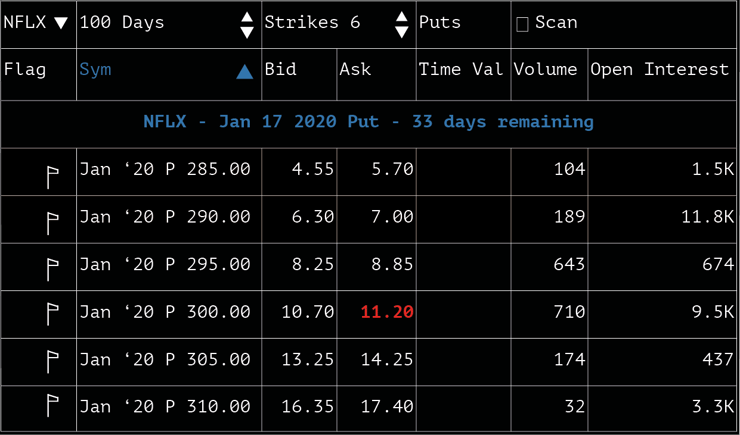
At the close on December 13, NFLX was at $298.50. I can buy a put option with a strike of $300 for $1,120 if I’m bearish and think it’ll go down further.
I’ll lose money if the price stays above $288.80. I only stand to profit when the price falls below $288.80. I’ll lose my entire premium to the seller if the price is above $300 on January 17.
Put Option Formula
There are so many ways to trade options. The formulas can get very complex as you buy and sell multiple different contracts to hedge your bets.
Here are a few basic options formulas to help give you an idea of everything you need to consider when trading options.
You can put these into a spreadsheet to create your own put option calculator.
These formulas work on the buying side of put options…
Open Profit/Loss
= [Strike price] – [current stock price] – [premium]
You’re in a profitable trade if your number is positive. But if the number is negative, you’re sitting on a loss.
Breakeven
= [strike price] – [premium]
This formula lets you know as a buyer what the price needs to decline for you to break even.
Price of Contract
= 100x [premium]
Remember that the price you see isn’t the price you pay.
Where to Trade Options
You can trade options through a reputable brokerage. Some do it better than others. Other factors you should consider are your account size and trading style.
If you trade with a $3,000 account, you need a different brokerage than someone with a $30,000 account. Just as those who trade all day on a desktop have different needs than someone managing a swing trade on a smartphone
Deciding on the right brokerage is unique to your individual needs. Don’t open an account just anywhere. Find the right brokerage for your needs and trading style.
Are Put Options Profitable?
All trading styles have the potential to be profitable — and they all come with risk. But like the methods I teach for penny stock trading, you must find a system and follow a set of rules.
I’ve covered the basics of buying and selling put options. You now know how to profit. If you’re a buyer, the price must decline. If you’re a seller, the price needs to stay above the strike price.
The risks often outweigh the rewards. It’s important in all trading — whether penny stocks or options — to only take the best setups.
Always make sure you use proper risk/reward no matter what you trade.
Understanding Put Options Charts
Although some do actually chart the price of options over time, we won’t get into that today. Know that in general, the premium of put options and call options decrease over time.
You want to pay attention to the bid and the ask. These work the same as stocks. But the spread can be quite large as you can see in this TSLA example.
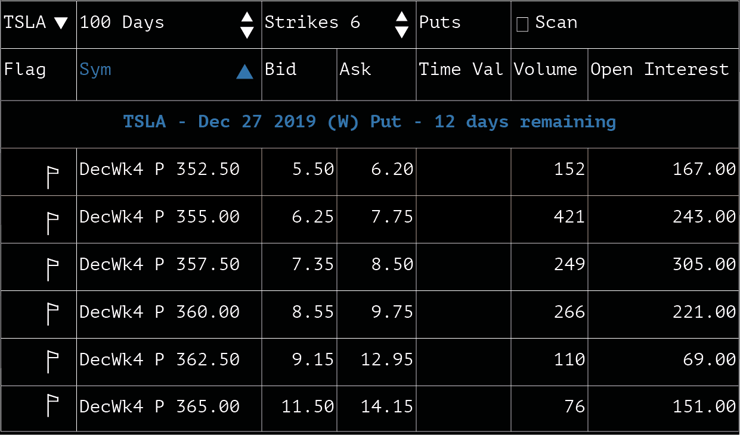
The premium spread can vary by 10%–30% or more. This is a huge gap when you compare it to stocks for which a spread of 1%–2% is considered large.
This put options chart shows that there’s a clear significant risk to trading options. Understand the basics of buying and sell stocks before you start making bets on their future moves.
I don’t like to try to predict. My trading style is to react to the price action. No one in history has been able to predict the future consistently over time.
I’ve been trading for over 20 years. My best trades come from reacting to price — not predicting it.
How to Find the Right Put Option to Buy
Much like trading, you gotta find a plan that works for you. There’s no magic formula that works for everyone.
Options traders love to make bets on earnings. You can bet on the long side by buying calls, and at the same time bet on the short side by buying puts. If the swing is big enough in either direction, it can turn a hefty profit.
Another big indicator is implied volatility, which can give you clues about a stock that’s about to make a big move.
The key point to remember here is that no indicator is right 100% of the time. You must learn to manage your risk.
If you’re just getting started and trying to figure out where to start with trading, I think it’s smart to start small. Options aren’t the best place to start. My trader checklist provides a solid framework for you to build on.
Duration of Time
Options contracts have set expiration dates. Options traders often like to trade during different time frames.
So the duration of time can vary greatly. It depends on your trading style and your unique, customized trading plan.
Amount You Can Afford
How much you can afford to trade is a highly personal decision. The answer varies for every trader. First, consider your risk tolerance … Can you stomach losing $500 on a single trade? That’s what the TSLA trade we looked at earlier would cost.
With penny stocks, you can trade using a small account, but options require more capital. For an options account, it’s not wise to risk more than 5% of your account on a single trade.
Options trading can vary in price from around $100 to well over $1,000. For that reason, I wouldn’t consider trading options with an account below $20,000.
That’s one more reason trading options isn’t a beginner’s game.
Length of Move
The move always ends on the expiration date of the contract. You can buy it in advance up to 100 days. Remember, option prices typically go down over time, so they start out high.
You don’t want to buy too close to the expiration date, either. That can greatly limit the amount of time you have for a move to play out.
The longer you hold an option contract, the more likely it is to move in the direction you want. But the further out you buy, the more expensive the premium is.
I’m talking in circles a bit here … In short, it’s complicated. As a general starting point, you can buy and sell between 30 to 60 days away from expiration. That can provide some balance between premiums and allow enough time for the stock to move.
Put Option Strategies
From a married put to an iron condor, there are dozens of different strategies you can use to trade options. And they can vary greatly in cost and complexity.
For our purposes today, I’ll review three different strategies to show the level of complexity that can come with options trading. Let’s start with the most basic.
Put Option Strategy #1: Long Put
This most basic strategy is what we’ve been discussing with TSLA. If you think a stock will decrease in price, you can buy a put contract and profit from its fall.
Put Option Strategy #2: Protective
Check out the following TSLA chart:
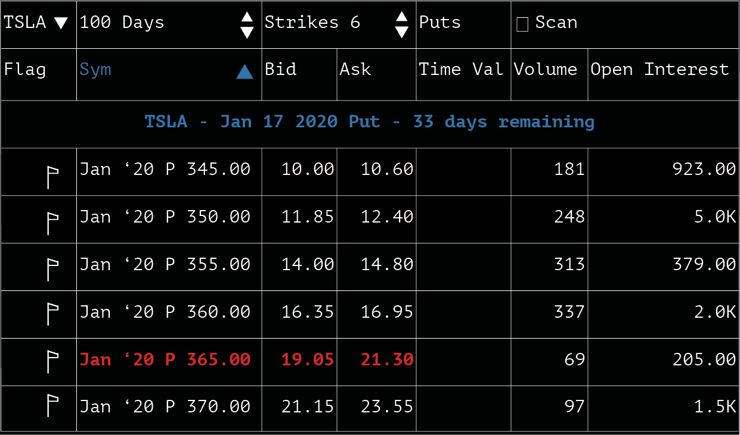
This is essentially an insurance policy for a long position. Here’s how it works…
- You buy 100 shares of TSLA for $358 (near the closing price on December 13).
- You buy a single put option with a strike price of $365 for a $20 premium — your total cost is $2,000.
Now you’re protected from a big loss. If the price drops more than $20, the put will increase in value at the same rate your long position will decrease in value. This strategy essentially limits your total loss up to a certain date. This example protects you through January 17.
But if the price goes up as expected since you had a long position, you need the price to increase $20 per share to cover the cost of the put option premium.
If the price stays flat or increases less than $20, you lose money, albeit a capped amount.
Put Option Strategy #3: Butterfly
This is by far the most complex strategy we’ll look at. Look at the chart for The Walt Disney Company (NYSE: DIS).
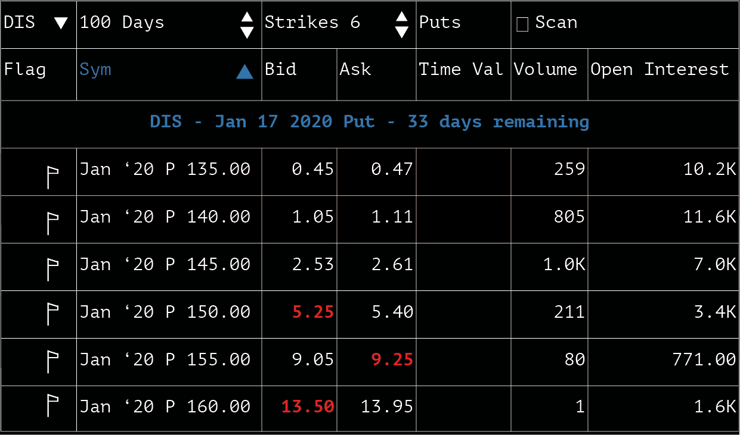
This strategy requires three transactions, and using more than one option is known as a put spread option.
- Sell one put for $5.25
- Buy two puts for $9.25
- Sell one put for $13.50
If executed at this price, you’ll receive $1,875 for the premiums you sell. And you’ll spend $1,850 for the options you buy. You keep the $25 difference.
The positions essentially cancel each other out, so you keep the $25 no matter what.
Options traders try to actively trade these positions to maximize their winnings. This comes with increased risk and can potentially cancel out any small profit you managed to make if you don’t manage the trade perfectly.
Conclusion
I hope you have a better understanding of the option market now. Next time you hear “how do you write a put position?” … you’ll have a better idea.
Always remember that over 90% of traders lose. Options can give you a sense of security — but remember that big rewards come with big risks. And taking large risks can make it tough to be consistently profitable.
Most stocks don’t make 10%+ moves, and you can try to predict 30–60 days out … But bottom line, it can be extremely difficult to be consistently profitable trading options.
I’ll stick to trading and teaching penny stocks. Options are too complex for me, and I think they’re too complex for beginners. These strategies and tips are what work for me.
If you’re serious about learning the markets and willing to study and work hard, apply for my Trading Challenge.
I want to know what you think! Leave a comment below…



Leave a reply