Traders on twitter love posting their photoshopped, I mean big wins on the platform. Look around, and they’ve got you believing they’ve never had a trading loss.
But how many actually post their results?
I make it a point to show EVERY trade I take RIGHT HERE for anyone to see, whether you’re one of my students or not.
Anyone can cherry-pick their best trades and mislead the public.
But I pride myself on CONSISTENCY and TRANSPARENCY.
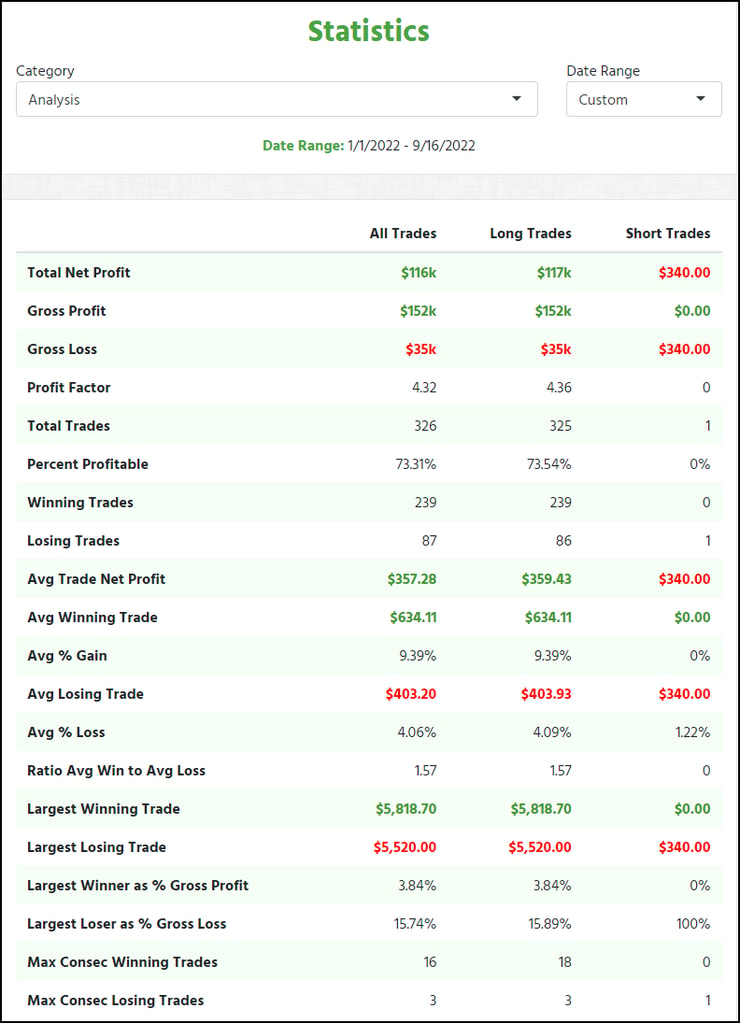
Just take a look at my stats this year:
Year-to-date, I’ve made ~$116,000 in profits across 326 trades.
Yet, my average win is only $634.11, and my average loss is only $403.20.
Most folks would be happy with that kind of annual profit.
What they don’t realize is that it doesn’t require +$5,000 wins to get there.
Small wins can add up.
That’s why I want to share with you a simple blueprint to help you create a plan for CONSISTENT profits.
Table of Contents
Collect Data

Before you can determine the correct size, you need data.
I track every one of my trades here at Profit.ly
Every one of my students who became a millionaire trader kept a journal.
Some were more robust than others, but they all had the same objective – summarize your results.
Most of you can download your trade transactions and use that as a starting point.
All you really need is your:
- Position size
- Entry
- Exit
- Date
- Symbol
Ideally, you’d want to log your:
- Profit target
- Stop loss
- Trade type
Once you collect enough data, you’ll want to calculate the following stats, similar to the screenshot of my account:
- Win-rate
- Average % win
- Average % loss
- Overall profit
This is your starting point.
Notice that I put the average percentage win/loss, not the dollar value. I’ll explain why that is in the next section.
Analyzing Your Size

Once you collected the data and calculated your stats, it’s time to determine the correct position size.
Base the position size off your potential losses, not profits.
Here’s an example.
Say you have a $5,000 trading account.
Ideally, you don’t want to risk more than 5% of the account on any one trade, or $250.
You look at your data, and it says your average loss percentage is 8%.
If you take $250 and divide it by 8%, you get a position size of $3,125.
This is the maximum amount you put to work on any trade.
If your entry is $2.00, you would buy no more than 1,500 shares.
With an OTC penny stock entry of $0.095, you would buy no more than 32,500 shares.
More Breaking News
- Strategic Moves Propel CCH Holdings: Stock Soars
- Itau Unibanco Announces Q4 Earnings as Investor Interest Grows
- AZI Stock Slips as Investors Eye Key Developments
- Bitmine Immersion Technologies Secures Strategic Edge with $14 Billion Crypto Holdings
In both examples, I rounded down to an even lot.
When to Scale
It might seem like a good idea to just naturally scale up as your account grows.
However, I’d caution you against that.
Instead, take a stair-step approach.
If I start with a $5,000 account, I want to keep my max loss at $250 until I reach $7,500.
Then, I can increase my size.
But between $5,000 and $7,500, my position size remains the same.
Also, if I take a bunch of losses in a row, I want to cut my position size down and give myself a chance to regroup.
Strings of losses will happen. But, you want to ensure it isn’t caused by poor decision-making.
Pay Attention to Volatility

Markets can and do change.
You either adapt or lose.
I talked about how August and September were difficult months for stocks.
Volatility increases, as does the chance of crashes.
When volatility increases, position size should decrease.
Think of it this way.
Increases in volatility mean your average losses are likely to increase.
So, if they increase, you need to compensate with smaller position sizes.
Now, this doesn’t have to be a one-way street. You can increase your profit targets if it makes sense.
Final Thoughts
Err on the side of sizes too small rather than too large.
More traders blow up their accounts from massive losses than by not taking enough profit.
—Tim


Leave a reply