I love surprising my new Millionaire Challenge students.
They see how much I trade and assume I must have eyes in the back of my head.
How else would I find so many trades week after week?
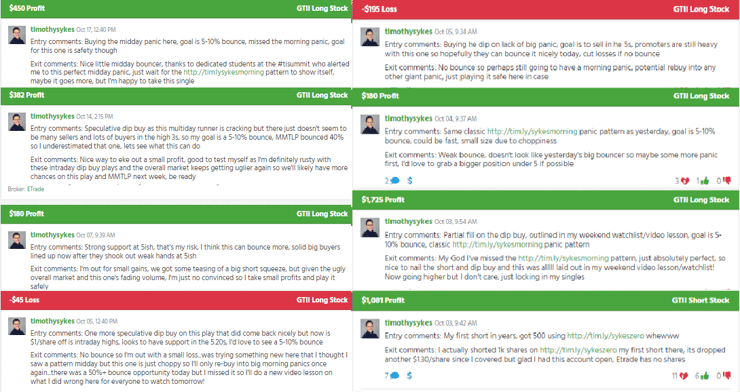
But guess how many times I traded Global Tech Industries Group Inc. (OTC: GTII) in October?
Eight times with a 75% win rate for $3,758 in profits
On any given day, I actively watch 3-6 stocks and have fewer than a couple dozen on my watchlist.
You see, all I need is one good stock to trade.
Naturally, everyone wants to know how I find these choice stocks.
Well, let me tell you…
Volatility is Your Friend

2025 Millionaire Media, LLCI like stocks with big moves.
I’m not talking about ones that jump 3%, 5%, or even 10%.
My favorite stocks are ones that go parabolic.
If you look at my 7-Step Penny Stock Framework, you’ll find examples of tickers that make gains of 50%, 100%, 200%…the bigger the better.
Some traders worry about diving into OTC and penny stocks because…well, they’re typically garbage companies.
That’s EXACTLY what I want.
With big stocks, I never know what stories lurk on the horizon or the games promoters play.
Instead, I assume all penny stocks are suspect and treat them accordingly.
Stocks for profitable companies very rarely double on a single day’s news.
That happens all the time with penny stocks.
Rather than take huge positions in big names to carve out a few pennies I take smaller positions in highly volatile penny stocks.
The key is to stack the odds in your favor and manage your risk.
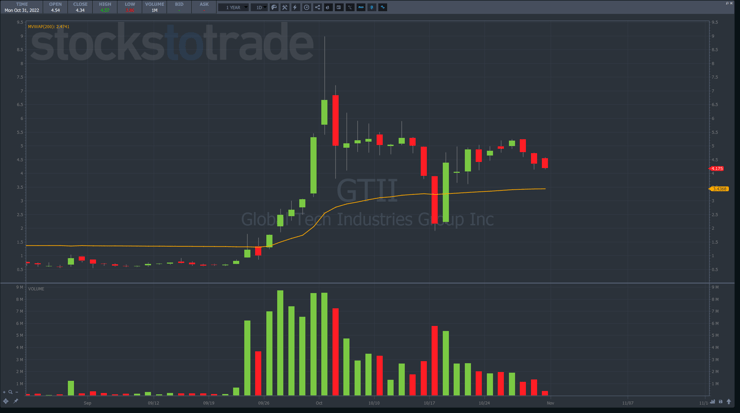
Take GTII for example.
Shares went parabolic before crashing back down to Earth.
From late September to early October, shares went from below $1.00 to almost $9.00!
That’s a ridiculous gain in such a short amount of time.
In less than a month, GTII dropped back down to $2.00.
Swings like these provide traders with multiple opportunities if you know how to identify and exploit them.
For example.
Once the stock topped out, I watched for an opportunity to catch a panic dip buy opportunity.
At first, this might appear like I’m trying to catch a falling knife.
But I assure you, as my students spend time studying, they begin to understand what to look for and where.
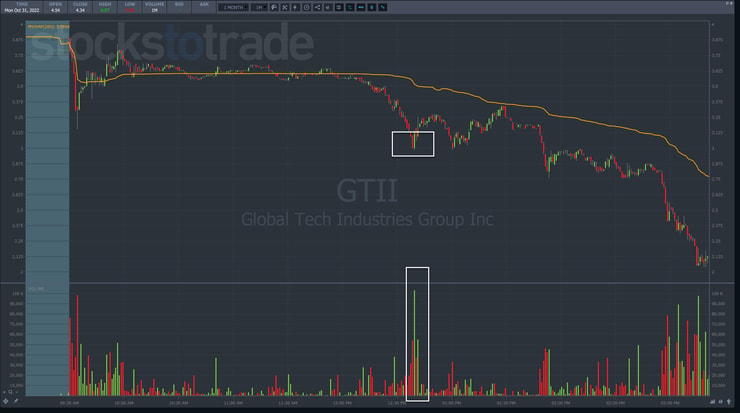
If you look at the list of trades above, you’ll notice one of them was a dip buy on October 17. That was the day GTII dropped hard on heavy volume, bottoming out just below $2.00.
What made this spot so special?
First, it had a massive volume spike.
Second, it ran into a round $3.00 number.
Third, that was also the former breakout area from the end of September.
Did it have to stop there?
No.
There are multiple places that have a higher probability of acting as support than others.
When you combine that with price action, Level 2 data, and other techniques I teach, you begin to see how some spots are more likely to create a bounce than others.
You Never Know Until You Do

2025 Millionaire Media, LLCWhen I buy a panic dip, I do it with the full knowledge I could be wrong.
Sometimes, I misread the price action and the stock keeps falling.
That’s why I always cut losses quickly.
Despite what it may seem, I have no idea whether a stock is about to find its final top or bottom before it happens.
And honestly, I don’t try to.
Instead, I rely on my framework to identify where a stock is in the cycle.
Then, I use that information to select the strategy best suited for that phase.
It’s not rocket science. It’s experience.
Not every stock follows the 7-Step Framework to the letter.
And even if they do, it doesn’t mean it will offer an appropriate setup.
Just because a stock goes Supernova doesn’t mean I automatically have to trade it.
The pattern gets things started.
The setup is where it comes together.
You can have a pattern that never creates a good setup.
But you can never have a good setup without a pattern.
Think on that one.
—Tim


Leave a reply