Promoters prey on our emotions.
They claim to have a unique insight that allows them to predict parabolic price moves.
The louder they get, the harder they are to ignore.
Eventually, they suck those last buyers before yanking the rug out from under them.
I caution everyone, not just my students, to never fall in love with a stock.
Those Reddit loudmouths who talked a big game during the meme stock runs were largely silent when those same stocks kicked the bucket.
Right now, those same folks are at it again with IPOs.
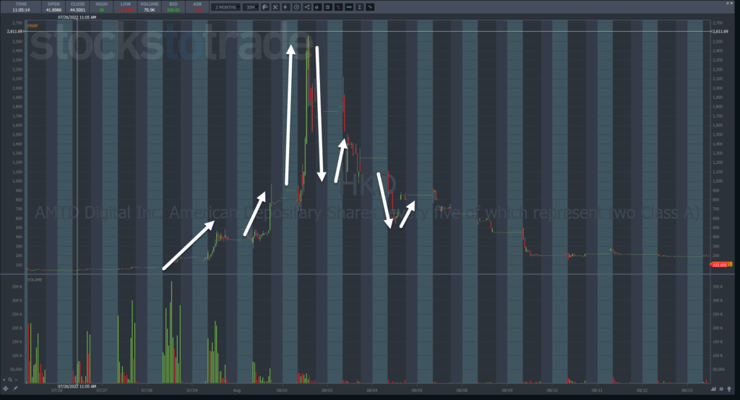
They managed to push AMTD Digital (NYSE: HKD) up +12,000% before it crashed.
Stocks that go Supernova follow the same dynamics time and again.
The good news is that it creates opportunities for traders.
Without giving away the farm, I’m going to show you a few key spots to look for setups when stocks go parabolic.
Learn the 7-Step Framework

I encourage everyone to study my 7-step penny stock framework.
Normally, information like this costs thousands of dollars.
But it’s hard not to see how these stocks follow the same pattern over and over.
Take a look at HKD.
It all starts with the initial ramp that gets everyone excited.
This is the point where it should get on everyone’s radar. It may not continue higher and could easily fade away. But you ALWAYS want to keep track of these initial moves – at least until they completely falter.
After the initial move, you either get a sideways consolidation or a pullback.
For those looking to take a long position, to ride the wave, this is where you would consider an entry.
However, this doesn’t work with just any stock that’s had a nice run.
They need to fit in a theme.
Right now, that’s IPOs.
Before that, it was oil & gas stocks.
Themes should be fairly obvious when you look at a cross-section of recent runners.
If you don’t see one, don’t force it.
That’s one of the great things about my chat room. Students get an opportunity to collaborate and share what they see.
Because in this case, two heads are absolutely better than one.
Now, even if you haven’t discovered a theme, you’ll know a Supernova once it starts to crash.
When stocks move lower off the backside of a parabolic move, there’s often opportunities to dip buy.
This isn’t easy at first. But with some practice and discipline, you’ll know where to find potential bounces that you can scalp for 5%-10%.
That same dip buying can be used as the stock fades into oblivion. However, I wait until it gets a decent bounce before considering a dip buy.
I look for stocks up 30% or more.
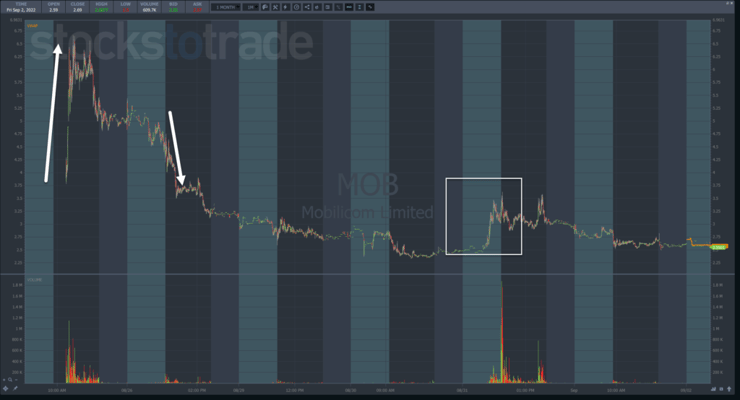
Here’s what that might look like on Mobilicom Limited (NASDAQ: MOB), a more recent IPO runner.
I noted the parabolic move up and then the crash down.
On that second arrow, I’d typically look for a dip buying opportunity.
This stock didn’t provide much of one, going from $3.50 to $3.75. But it still counts.
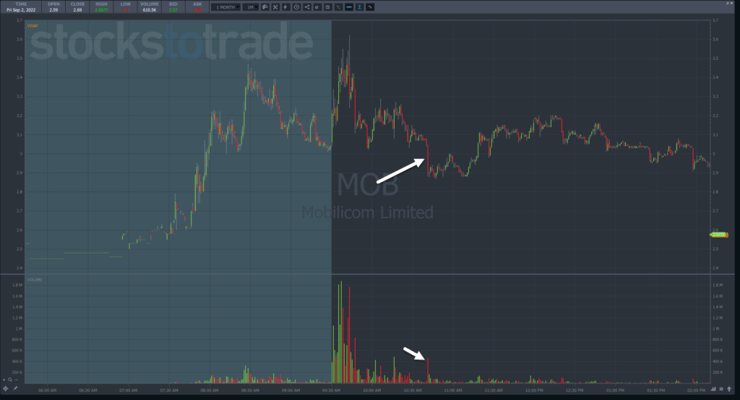
However, a nice setup appeared several days later in the area I highlighted in the box.
Shares took out the morning low on some heavy volume. Then, they drifted sideways.
A trader could step in there and buy shares against the low as a potential trade.
As long as you get a decent entry, your maximum loss should only be a few pennies, while your potential profits should be $0.15-$0.30.
If you set up the risk/reward ratio correctly and cut losses quickly, you don’t have to win many trades to turn a profit.
Final Thoughts

The first step for any trader is to find patterns that repeat the same price action over and over.
From there, it’s simply a matter of crafting a strategy that exploits those moves.
And there is no better pattern to start with than my Supernova.
—Tim


Leave a reply