You must understand market volatility if you want to trade in the markets…
It can have a huge impact on your potential profits and losses.
Three out of four stocks follow the overall markets. If there’s market volatility that means more volatile stock moves.
That’s something I love to take advantage of in my trading. And it’s why I love penny stocks — they’re some of the most volatile stocks in the market.
But increased volatility can also mean increased risk…
So you must understand what causes market volatility and how it can impact your trading.
In this post, I’ll give you a simple volatility definition and volatility formula. Plus, find out my top tips for trading market volatility … Let’s go!
Table of Contents
- 1 What’s Market Volatility?
- 2 How to Calculate a Stock’s Volatility
- 3 Key Trading Tips for Volatile Markets
- 3.1 1. Try to Identify the Reason for the Market Volatility
- 3.2 2. Acknowledge When the Market Has Shifted
- 3.3 3. Evaluate Other Potential Opportunities
- 3.4 4. Refocus on Your Education
- 3.5 5. Learn From Those Who Find Success
- 3.6 6. Remember: Panic Is Not a Strategy
- 3.7 7. Consult Your Mentor
- 3.8 8. Don’t Give Up
- 4 Recap: Market Volatility in 2020
- 5 Market Volatility in 2021: What to Expect?
- 6 Frequently Asked Questions About Market Volatility
- 7 The Bottom Line
What’s Market Volatility?
To understand market volatility and how it can work for you as a trader, you need a basic volatility definition…
Volatility is a statistical measure of the gap between the low and high prices of a stock.
In other words, it’s a measurement that accounts for the stock’s price range — usually over time and in relation to the current price.
To gauge market volatility as a whole, you make a similar calculation using one of the major stock indexes, like the S&P 500 or Nasdaq.
I’ll give you the formula to calculate market volatility later in this post. But first…
Is Market Volatility Good or Bad?
That depends on who you ask. I love it. It allows me to take advantage of huge price swings in a short amount of time. I don’t like to hold sketchy penny stocks too long.
I want to be in and out of positions quickly. My goal is to take the meat of the move and move on to the next trade. In uncertain markets, I don’t even like holding stocks overnight since volatility can also increase risk. More on that later…
New to penny stocks? Learn about this niche that helped me make over $1.1 in trading profits in 2020.* Get my FREE penny stock guide here.
(*Please note: My results are far from typical. Individual results will vary. Most traders lose money. I have the benefit of years of hard work, dedication, and experience. Trading is inherently risky. Do your due diligence and never risk more than you can afford to lose.)
What Causes Market Volatility?
Market volatility is created by mass buying or selling. Increased volume in the market can also increase volatility. The higher volume of trades in one direction creates bigger moves.
Market volatility is usually triggered by economic factors like interest rates, or an unpredictable ‘act of god’ that impacts oil or commodity prices.
Economic uncertainty can cause fear in investors and traders. That increases volatility. And it’s why increased market volatility is usually associated with bear markets. While bull markets tend to be less volatile.
More Breaking News
- KeyBanc Boosts Intuitive Machines with Higher Price Target
- Prosperity of Tokyo’s Finance Hub: UOKA Shines
- Valterra Platinum Strengthens Position with Impressive Earnings Surge
- Battalion Oil Shares Surge After Major Midstream Agreement
Implied Volatility vs. Historical Volatility
Implied volatility is more relevant to option traders. They use it to make an educated guess on how volatile a stock will be in the future. But it doesn’t indicate whether the price will move up or down.
While implied volatility attempts to measure volatility in the future, historical volatility is based on the past moves of the stock. It can be measured by the percentage change in a stock’s price over a certain time frame.
That’s why I always watch former runners. Stocks that have spiked before can spike again — because they’re volatile. Since I’m a day trader, I want to trade stocks with a big daily range. I don’t care how much a stock moves over months, years, or decades.
How Are Volatility and Risk Related in Trading?
Volatility increases when there’s uncertainty in the market. With increased volatility comes bigger price movements, which also increases the risk…
High volatility means big price swings in both directions. Which increases the risk of stocks or the market tanking.
That’s why rule #1 is to cut losses quickly.
If a stock goes against you, get out. Don’t bag hold a losing position and hope the stock will go back up. Accept your losses when you’re wrong and move on.
Also, take profits when you have them and sell into strength. Don’t get greedy.
What Does High Volatility Mean?
High volatility means there’s a wide range between the upper and lower prices…
- When would-be buyers outnumber potential sellers, high volatility sends the stock price higher.
- When more people want to sell, high volatility sends the price of the stock lower.
Both moves are examples of supply and demand combined with high volatility.
Benefits of Trading in High-Volatility Markets
I love trading high-volatility penny stocks. My trading strategies depend on high volatility.
What’s volatility trading? It’s planning your setups around high volatility. While volatility isn’t the only factor to consider before a trade, if a stock’s not volatile, I’m not interested.
Big movements in volatile markets mean I don’t have to get in and out at the very bottom or top of the price move for the trade to be successful…
Like I said before, I aim to take the meat of the move and move on to the next opportunity.
And I tend to trade conservatively. So I exit when a trade hits my goals, as I outline in my trading plan. I almost always sell too soon but taking small profits allows my account to grow over time.*
Want trade alerts and commentary every time I enter and exit a trade? Subscribe to Profit.ly and I’ll send alerts right to your inbox. It’s one way you can learn more about the process behind my trades.
Want to know more about how I handle volatile markets? Get my NO-COST “Volatility Survival Guide” here.
How to Calculate a Stock’s Volatility

There’s more than one volatility calculation out there — it can be a little subjective. The classic measure is called standard deviation.
Because I’m interested in volatility as it relates to price swings, I’ll show you how to calculate volatility in a different way first.
I’ll use the average true range (ATR) method.
(Pro tip: You can add an ATR indicator on most stock charting platforms — so you won’t need to do these calculations yourself.)
- Calculate the true range (TR) for one period. The TR is the difference between the high and the low. Here’s an example: A stock’s daily high was $10, and the low was $6. The true range is $4. (10﹣6 = 4). The standard number of periods to calculate the ATR is 14, but for simplicity, we’ll use three.
- Let’s assume the three daily TRs are $4, $3, and $4.25. Now find the ATR: (4 + 3 + 4.25) / 3 = 3.75.
- Next, use the ATR to calculate volatility as a percentage of price. Say the stock’s current price is $14. Divide the ATR by the current price and state it as a percentage: 3.75 / 14 = 0.27, or 27% volatility. (This is super high volatility! You won’t find many blue-chip stocks even close to this.)
Market Volatility Formula
This is one of those times I’ll tell you to do your homework. I could write five posts just on different types of volatility formulas. Seriously!
However, I’ll give you the standard deviation formula so you can see how it works. Imagine you have three closing prices of $12, $14, and $16.
- Find the average: (12 + 14 + 16) / 3 = 14
- Calculate the deviation by subtracting the average value from each day’s close:
12﹣14 = –2, 14 - 14 = 0, and 16﹣14 = 2. You get ﹣2, 0, and 2. - Square the deviations and you get 4, 0, and 4.
- Add the squared deviations: 4 + 0 + 4 = 8
- Divide by the number of data values (three trading days in this example): 8 / 3 = 2.66.
- Find the square root of the variance: The square root of 2.66 = 1.63 … that’s the standard deviation.
Many institutional investors use standard deviation to calculate volatility and risk. It gives traders an idea of how far prices might swing from the average.
Market Volatility Example
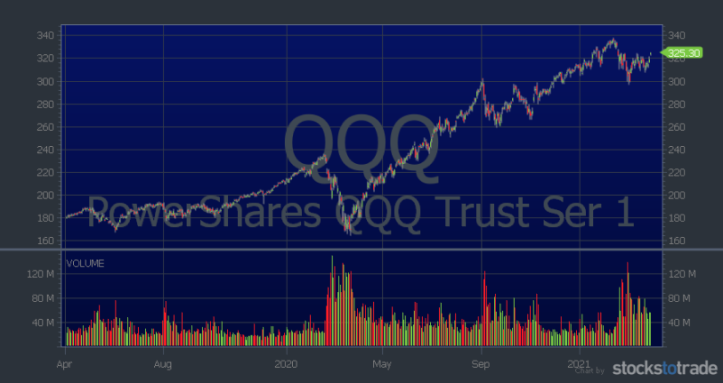
For a good example of recent market volatility, look no further than the Invesco QQQ Trust (NASDAQ: QQQ). It’s an ETF that closely follows the Nasdaq. Check out the two-year chart below…

Notice the low volume and small candlesticks leading up to March 2020. As soon as there was uncertainty, a downtrend started. Volume and volatility increased, shown by large volume bars and candlesticks.
Following the large crash, volume and market volatility remained higher than it was previously. Also, notice how volume spikes when the market dips.
Key Trading Tips for Volatile Markets

1. Try to Identify the Reason for the Market Volatility
When you see an increase in market volatility, it’s a good idea to try to understand the reason. With individual stocks, it’s usually something you can identify, like news.
But when it comes to overall market volatility, think big world news events. Like the lockdowns that massively affected the markets in 2020.
But other times, the reason might not seem so obvious…
Algorithmic trading, stop losses, and forced buying or selling due to broker margin calls can all increase market volatility.
Some traders call the calm period a listless or stagnant market. Eventually, volatility becomes necessary to get things moving again.
2. Acknowledge When the Market Has Shifted
Sometimes we all need a little wake-up call. Markets change — and when they do you have to change with them. Otherwise, you can get pummeled.
One of my first big trading lessons happened in the spring of 2000 when the easy money of the dot-com boom came to a screeching halt.
The Nasdaq tumbled along with all those cash-eating, no-revenue companies. Suddenly, the patterns I used to go from a small account to well over six figures were not available.*
Volatility was through the roof at the time, as panic followed panic.
It was enough to put a little fear in me, so I sat on the sidelines for a while and watched things unfold. I wasn’t aware at the time how good my instinct was. I was itching to trade — and it forced me to start looking for new plays.
It will happen again when the recent market volatility slows down. If and when the bubble bursts, many traders will likely go down with the ship because they lack education. It seems easy to make money in a booming volatile market. But when it shifts or slows down, you must adapt…
That’s when you need trading education. You need to know how to trade small, focus on the best setups, and protect your account.
3. Evaluate Other Potential Opportunities
This goes hand in hand with adapting to market changes. When things seem out of control, step back and look at the big picture. Then start looking for other opportunities.
Take time to watch the market for patterns that are working. Don’t be biased one way or the other.
Back when I was forced to look for new plays, I discovered short selling. It worked well for me back then. But now it’s an overcrowded strategy. It creates an increased risk of short squeezes.
Will short selling be a good strategy in the future? Who knows. Watch, adapt, and react. Don’t try to predict.
4. Refocus on Your Education
When things get a little rough — and I know the market behaves erratically at times — the best thing to do is step back and dig into your education again.
Trading is a lifelong skill. It takes time and massive effort to master. Once you’ve been through a few up-and-down markets and high-volatility periods, you’ll have a better idea of how to respond.
For now, understand that you should be studying all the time.
When markets shift — study more. Consider it your chance to witness firsthand what kinds of patterns work in different markets.
You can also paper trade to test new strategies before risking your hard-earned money. Prepare yourself for next time — because high-volatility markets seem to come and go.
Start your trading education by joining my 30-Day Bootcamp. It’s a month’s worth of lessons with daily assignments and homework. And you can work at your own pace and repeat it as many times as you like. Bonus: It comes with “The Complete Penny Stock Course” book and my “Pennystocking Framework” DVD.
5. Learn From Those Who Find Success
What would you do if you wanted to be good at something? Would you hang out with or listen to someone bad at it?
I hope not. If you’re smart, you’d seek out the best. You’d figure out what they did to get where they are.
Trading is the same. Find the traders making money — like my Challenge students turned mentors and moderators.
Figure out where they hang out, like the Trading Challenge chat room. Then hang out there so you can learn from them. Pay attention to what they’re doing. Ask thoughtful questions.
The top Challenge traders are upfront about both wins and losses. That’s something you should take advantage of. Model success and learn from failures. That’s how you shorten your learning curve.
6. Remember: Panic Is Not a Strategy
Some traders panic. Don’t be like them.
As you improve, you’ll recognize this more and more.
Go one step further: Have a strategy in place for when others panic.
What’s the easiest way to avoid panic? Have a plan. Practice the plan: Go over it several times.
Paper trade your plan until it’s second nature. Then, when you trade the plan with real money, you’ll know what to do when things go wrong. (It happens to every trader at some time.)
I know profitable traders who only win a little over half the time.* They trade their plans, don’t panic, and cut losses.
So make a plan and stick to it. If things go wrong, cut your losses quickly and learn from the trade.
7. Consult Your Mentor
Trading can be a lonely profession. When the market’s nuts and you’re trying to figure out what to do, your mentor can be an excellent sounding board.
Too many traders lock themselves away researching, watching stocks, watching the markets.
There’s a great benefit of networking with other traders — especially a mentor. If your mentor has been around a while (I have 20+ years in the trenches and 10+ years of teaching) they’ve probably been through periods of high market volatility.
Take advantage of this knowledge.
I’ve been there, done that in almost every type of market. When I started out, I didn’t have a mentor. I had to learn the hard way. It’s one of the reasons I started teaching.
I give live Q&A webinars for Trading Challenge students every week. And if there are any good trades, I’ll trade live so students can learn what trading looks like in real time.
Many top students also give webinars. And some of them are now millionaire traders and moderators in my Challenge chat room.* They answer questions daily and share their thoughts on the market.
Want access? Apply for my Trading Challenge today.
(*Trading results are not typical. Individual results will vary. Most traders lose money. My top students and I have the benefit of many years of hard work and dedication. Trading is inherently risky. Always do your due diligence and never risk more than you can afford to lose.)
8. Don’t Give Up
I have story after story of students who wanted to quit at one time or another but stuck it out. Now they’re crushing it.*
It’s all about gaining experience, learning from mistakes, and never giving up.
Do you know how many people quit when they’re so close to putting it all together?
The best traders learn from their failures. They don’t give up.
Don’t let the market volatility get to you. Embrace it.
Recap: Market Volatility in 2020
The 2020 market volatility was insane … Many Americans got stimulus checks, and the markets jumped after that. We saw a ton of volume in the market as new traders looked to the markets as a way to make ‘quick’ money.
That increased volume and volatility created tons of opportunities. Multiple hot sectors all ran at once — EVs, stay-at-home stocks, food delivery, crypto stocks, and biotechs.
There seemed to be 1,000% gainers almost every day. But that kind of action can’t last forever…
Market Volatility in 2021: What to Expect?

2021 started hot. Bitcoin reached all-time highs, sparking crypto-related stock runs. Then NFT stocks became the big thing. And a third wave of last stimulus checks went out in March.
What does that all mean for the future of the markets? I don’t try to guess. Instead, I’m prepared to react.
I’ve been warning traders the market bubble could burst at any time. So be ready to adapt.
Will the volume dry up overnight, probably not…
But we could see more traders exit the market and give up. It’s hard to make money when stocks don’t just go up. That’s why having a trading education is so important.
Frequently Asked Questions About Market Volatility
What Is the Best Volatility Indicator?
Traders can use a few different indicators to measure market volatility. The Chicago Board Options Exchange Market Volatility Index (VIX) is an indicator of future expected market volatility. If you want to know the volatility of a particular stock, add the average true range indicator or Bollinger Bands® to your charts.
Is There a Volatility ETF?
Here are the top five volatility ETFs: iPath Series B S&P 500® VIX Mid-Term Futures ETN (VXZ), iPath S&P 500 Dynamic VIX ETN (XVZ), ProShares VIX Mid-Term Futures ETF (VIXM), iPath Series B S&P 500 VIX Short-Term Futures ETN (VXX), and ProShares VIX Short-Term Futures ETF (VIXY).
Are Volatile Penny Stocks Good for Day Trading?
I think volatile penny stocks are the best stocks for day trading. They have the range and volatility to make quick trades. That’s what I think makes them great for growing a small account, as long as you have a process, discipline, and rules.
What Is the Most Volatile Market to Trade?
OTCs and penny stocks are considered the riskiest, most volatile stocks in the market. They move fast on news, press releases, and hype. They can have huge upward price swings but they can also tank just as quickly. That’s why you need education, practice, and a plan.
The Bottom Line
Market volatility can be a penny stock day trader’s best friend. Learn how to take advantage of it.
Watch the market in real time and paper trade to get a feel for how volatile penny stocks move.
Study the past.
You can learn a lot from past volatile markets and bubbles. Find out how you can apply what you learn to your current trading strategies and chart patterns.
Study all my blog posts on how I take advantage of volatility. And watch all my YouTube videos.
I talk a lot about high volatility and how it applies to my strategy.
When you’re ready to take your trading to the next level, apply for the Trading Challenge. It’s only for the most dedicated students. Are you ready to learn how to navigate any kind of market? Apply today.
How do you handle market volatility in your trading? Let me know in the comments. I love to hear from you!


Leave a reply