A first green day OTC is one of my favorite patterns. I think it works especially well for traders with a small account.
When you’re just starting out with trading you have to trade a little differently. You have to take the low-hanging fruit.
You can’t come into it thinking you’re going to make a ton of money. Unfortunately, that’s how most new traders think. It’s the wrong way to approach the market and it’s completely the wrong mindset.
You have to be willing to take what the market gives you. If you have a small account, that means sticking to repeatable patterns.
A lot of my most successful students started out trading this pattern and still do.
So in this post, I’ll go over the first green OTC meaning and how to trade first green day OTCs. I’ll even share some examples of my trades.
Let’s do this!
Table of Contents
What’s a Green Day in Stocks?
A green day in stocks refers to a green candlestick on the daily chart. A green candlestick happens when the opening price is lower than the closing price. It means the stock price went up throughout the day.
I like the first green day because I’m mostly a long-biased trader. I want to buy low and sell high.
A red candle on the chart means the opening price was higher than the close and the stock price went down throughout the day.
I’ll get into the differences between a first green day and a first red day later. First, let’s look at…
How to Trade the First Green Day OTC
The idea behind the first green day OTC is to buy a stock that’s closing near its highs to hold overnight. Ideally, the next morning there’s a gap up and you sell your shares for a potential profit.
The reason this pattern tends to work well with OTC stocks is that it allows you to take advantage of market inefficiencies. Because OTCs don’t trade after hours or in premarket, anyone who missed the move on the first day starts putting in orders before the open. That demand causes the stock to gap up at the open.
When I’m looking for an entry, I prefer to buy dips. I don’t like to chase stocks that are spiking. Instead, I usually only buy strength when it’s a breakout pattern.
I have a few strategies when it comes to buying the first green day OTC. I’ll get into more details of how to trade the first green day and share some of my trades later in this post…
Want to know which stocks I’m watching each week? Subscribe to my no-cost weekly watchlist here.
First Green Day vs. First Red Day
The first green day can be the start of a bigger, long-term move to the upside. Especially if it’s combined with high volume, a catalyst, or a hot sector.
Penny stocks can go supernova and move BIG in one day or go on multi-day runs. That would look like one big green candle or multiple green candles on a daily chart.
But once a stock has a huge move, traders start taking profits and short sellers start pressuring the stock…
When the stock price opens high and closes lower than the opening price, it creates a red candle on the daily chart. After a run-up of green candles, this is called the first red day.
What the First Red Day Signals
A first red day can be a signal for shorts to short sell and for longs to take profits.
It can signal a trend change and that the stock’s heading back down. But that’s not always the case, as you’ll see in my trade examples later…
The markets are all about trends. Stocks move up, down, or sideways. When a stock moves sideways, it doesn’t interest me. My focus is on the most volatile penny stocks. I want to take advantage of the big upward and downward moves.
You can learn these penny stock patterns in my “Pennystocking Framework” and “Pennystocking Framework Part Deux” DVDs.
Get my “Pennystocking Framework” DVD as a free bonus when you get in my 30-Day Bootcamp. You also get “The Complete Penny Stock Course” book written by my student Jamil. It’s an amazing value at under $100 for all three!
My Bootcamp is a month’s worth of lessons that you can do at your own pace. You get lifetime access so you can repeat it as much as you want. Get started today!
What’s a First Green Day Pattern?
A first green day pattern is a pattern on the daily chart.
The chart looks like a long-term downtrending chart with a lot of red candles. Or it can be a stock that goes sideways.
Then there might be news or a sympathy play to other stocks moving in the market. That brings in volume — maybe with a gap up.
After the downtrend or sideways price action, a green candle appears on the chart with higher than average volume. Like visuals? Stick around for the examples to see some charts.
Most Common First Green Day Patterns
A first green day appears on a daily chart. But how do you know when you buy intraday? And how do you know the stock will close strong?
Most of the time I trade these stocks in the morning — buying a dip on a spiking stock. A lot of students will ask me if it’s the first green day and if I’m gonna hold overnight…
It’s way too early to tell what the stock will do throughout the day. I make quick trades and take advantage of spikes. I trade safe, so I don’t hold all day to wait and see what happens.
Here are some examples of my favorite entries on a first green day OTC…
Dip Buys
Like I said, I prefer to buy dips. I don’t like to chase spiking stocks. When I buy dips, I’m looking for the stock to retest its previous intraday high or breakout to new highs.
I have over 700 video lessons on dip buying on Profit.ly. Apply for my Trading Challenge or become a Pennystocking Silver subscriber for access.
Sometimes a stock has such good news and high volume, it spikes fast and doesn’t offer a dip to get in.
HOD Breaks
If I miss a dip buy or the stock doesn’t give me one, I’ll watch for an opportunity to buy a breakout above the previous high-of-day price. I’ll either sell into the spike or hold overnight if it’s almost market close.
End of Day Strength
If a stock has been strong all day and is closing near its highs at the close, I’ll buy before the close to hold overnight. My goal is to sell into a gap up the next morning.
Because OTCs don’t trade after hours, the orders pile up in the morning creating a gap up at the open. I’m usually too cautious and sell right at the open.
Here are some examples of my trades…
More Breaking News
- BigBear.ai Shares Tumble: Investigation Insights
- Avantor: Expansion Unveiled, Now What?
- Amcor’s Fresh Move in Healthcare Packaging
Real-Life Examples of First Day Green Patterns
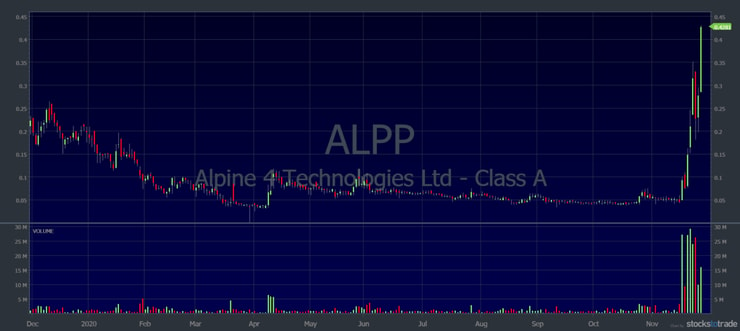
Alpine 4 Technologies, Ltd. (OTCQB: ALPP)
On November 17, I bought this stock before the close. I wanted to see if it would sustain for an overnight hold. This former supernova was running on news, so it had the potential to spike. I bought 81,000 shares at $0.0835. When it closed strong, I held overnight.
I sold into the gap up the next morning at $0.099 for a profit of $1,256.* The next day the stock had a red day. But that didn’t stop it from having a huge multi-day run…
(*Please note: My results are far from typical. Individual results will vary. Most traders lose money. I have the benefit of years of hard work, dedication, and experience. Trading is inherently risky. Do your due diligence and never risk more than you can afford to lose.)
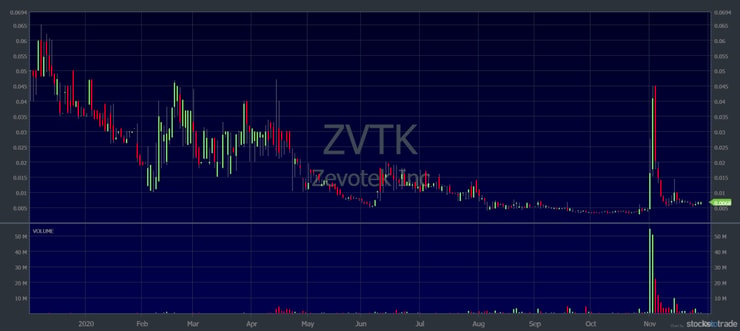
Zevotek, Inc. (OTCPK: ZVTK)
On November 2, ZVTK was an all-day runner, but in the afternoon, it had a little intraday panic. I bought the dip as a variation of my favorite morning panic pattern, with a goal to sell into the bounce. I bought 378,000 shares at $0.016.
It met my profit goals of around 30% so I didn’t have to have the extra risk of holding overnight. I sold at $0.022 for a profit of $2,268.*
You can see from the chart the stock had another huge day the next day. But after its first red day, the stock went right back down.
Tesoro Enterprises, Inc. (OTCPK: TSNP)
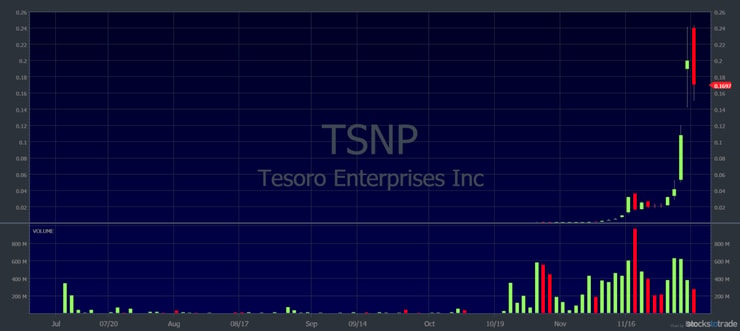
TSNP had its first green day on November 16. I bought it in the afternoon since it was holding near its highs, planning to hold overnight if it looked strong.
It started to look weak, and I took a small loss of $75. The next morning, the stock gapped up but had a morning panic right at the open. I profited $1,170 on the morning panic dip buy pattern.*
But my best trade on this stock was an overnight hold on November 27. It wasn’t the first green day, but it’s the same idea…
I bought the stock in the afternoon when it looked like it was closing strong. For my entry, I bought 423,000 shares at an average of $0.1048. I sold 227,000 shares before the close at $0.1067 — just to take some risk off holding over the weekend.
On Monday morning I got a perfect gap up and sold my remaining 196,000 shares at $0.185. My total profits on the trade were $16,159.*
This is a perfect example of how buying OTC stocks that are closing strong and holding overnight can grow your account exponentially.
Conclusion: Should You Trade the First Green Day OTC Pattern?
The first green day OTC is one of my favorite patterns and one that I teach my students in the Trading Challenge.
The first green day on an OTC stock can be the start of a long run-up, or the play can be over the first day. Always expect the worst and you won’t be disappointed.
I always trade overly safe and my rule #1 is to cut losses quickly. Never hold and hope a losing position will become a winner.
If you want to learn how my top students and I trade, apply to join my Trading Challenge. You get access to all my video lessons, DVDs, live trading webinars, and my Challenge chat room. It’s a great community of traders that help and support each other.
See you in the chat room!
Do you trade the first green day OTC pattern? Let me know in the comments … I love to hear from you!






Leave a reply